Review
. 2019 Sep 27;20(5):1655-1668.
doi: 10.1093/bib/bby040.

A comparison of mechanistic signaling pathway activity analysis methods

Affiliations
Review

A comparison of mechanistic signaling pathway activity analysis methods

Alicia Amadoz et al. Brief Bioinform. .

Abstract

Understanding the aspects of cell functionality that account for disease mechanisms or drug modes of action is a main challenge for precision medicine. Classical gene-based approaches ignore the modular nature of most human traits, whereas conventional pathway enrichment approaches produce only illustrative results of limited practical utility. Recently, a family of new methods has emerged that change the focus from the whole pathways to the definition of elementary subpathways within them that have any mechanistic significance and to the study of their activities. Thus, mechanistic pathway activity (MPA) methods constitute a new paradigm that allows recoding poorly informative genomic measurements into cell activity quantitative values and relate them to phenotypes. Here we provide a review on the MPA methods available and explain their contribution to systems medicine approaches for addressing challenges in the diagnostic and treatment of complex diseases.

Keywords: disease mechanism; mathematical models; networks; signaling pathways; systems biology; transcriptomics.


Figures

Figure 1.
Figure 1.
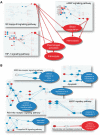
Schematic representation of the three families of methods: enrichment analysis, PT-based analysis and MPA. The conventional enrichment analysis assumes the existence of a background (A) in which an observed percentage (25% in the example) of the genes differentially expressed (or mutated, associated to a trait, etc.). If gene sets are sampled based on some property shared by all the genes (e.g. they belong to a given pathway), a scenario (B) in which 60% of them are differentially expressed is found; the application of a simple test will evidence that this gene set is significantly enriched in differentially expressed genes, whereas in other scenarios (C), the gene set would not be different from a random sample of genes from the background. A PT-based algorithm takes into consideration the topology of the gene set, and a scenario (C) in which the differentially expressed genes are more connected among them would get a better score that an alternative scenario (D) in which the level of connection of the genes is lower. The significance of this data set would depend on the algorithm that estimates the score and the specific test applied. In MPA, there is more or less specific definition of circuits (subnetworks) within the pathway that should be related to cell activity in some way, and the connectivity of such circuits will determine the potential changes in cell activity. If circuits define subnetworks connecting receptor proteins to effector proteins in a signal transduction pathway, the same number of active genes could allow signal transduction (E) or being incompatible with the arrival of the signal to the current effector proteins (F), even in scenarios that would be significantly enriched in a conventional enrichment method.
Figure 2.
Figure 2.
TPR or sensitivity was computed as the number of significant cancer pathways found, when cancer samples are compared with samples of the tissue of reference, divided by the total number of cancer pathways (14 for HiPathia and DEAP and 13 for the rest of methods, because PPAR signaling pathway [hsa03320] was not implemented in them) per method and cancer. Violin plots obtained using 12 cancer types show for any method the mean TPR in the central dot, all possible results, with thickness indicating how common, in the outer shape and the layer inside, represents the values that occur 95% of the time. The figure shows the methods ranked by TPR value. A Wilcoxon test with Bonferroni correction was used to compare successive TPR distributions to detect significant differences among them. Black lines denote significant differences between consecutive methods. Brackets define groups of methods with no significant differences in their performances.
Figure 3.
Figure 3.
FPR or specificity was computed as the mean of the number of significant cancer pathways found, when cancer samples are compared with cancer samples, divided by the total number of KEGG cancer pathways along 100 bootstraps, per method and cancer. Violin plots show average values and distributions of the proportions of false discoveries made by any method. The figure shows the methods ranked by FPR value. A Wilcoxon test with Bonferroni correction was used to compare successive FPR distributions to detect significant differences among them. Black lines denote significant differences between consecutive methods. Brackets define groups of methods with no significant differences in their performances.
Figure 4.
Figure 4.
Schema of the mechanisms behind the deactivation of the immune system (A) and the changes in the metabolism (B) caused by changes of blood transcriptome after death and subsequent postmortem cold ischemia [73].
Figure 5.
Figure 5.
Simultaneous comparison of sensitivities and specificities of the different MPA methods. The results obtained in the 12 cancers are used to obtain a mean value and an error. The x-axis represents 1 − the FPR. Horizontal bars represent in each point 1 SD of the FPR for the corresponding method.

References

    1. Kahvejian A, Quackenbush J, Thompson JF.. What would you do if you could sequence everything? Nat Biotechnol 2008;26(10):1125–33. - PMC - PubMed
    1. Shi L, Campbell G, Jones WD, et al.The MicroArray Quality Control (MAQC)-II study of common practices for the development and validation of microarray-based predictive models. Nat Biotechnol 2010;28(8):827–38. - PMC - PubMed
    1. Iwamoto T, Pusztai L.. Predicting prognosis of breast cancer with gene signatures: are we lost in a sea of data? Genome Med 2010;2(11):81.. - PMC - PubMed
    1. Ein-Dor L, Zuk O, Domany E.. Thousands of samples are needed to generate a robust gene list for predicting outcome in cancer. Proc Natl Acad Sci USA 2006;103(15):5923–8. - PMC - PubMed
    1. van't Veer LJ, Dai H, van de Vijver MJ, et al.Gene expression profiling predicts clinical outcome of breast cancer. Nature 2002;5(1):530–6. - PubMed