

ACPred-FL: a sequence-based predictor using effective feature representation to improve the prediction of anti-cancer peptides
- PMID: 29868903
- PMCID: PMC6247924
- DOI: 10.1093/bioinformatics/bty451
ACPred-FL: a sequence-based predictor using effective feature representation to improve the prediction of anti-cancer peptides
Abstract
Motivation: Anti-cancer peptides (ACPs) have recently emerged as promising therapeutic agents for cancer treatment. Due to the avalanche of protein sequence data in the post-genomic era, there is an urgent need to develop automated computational methods to enable fast and accurate identification of novel ACPs within the vast number of candidate proteins and peptides.
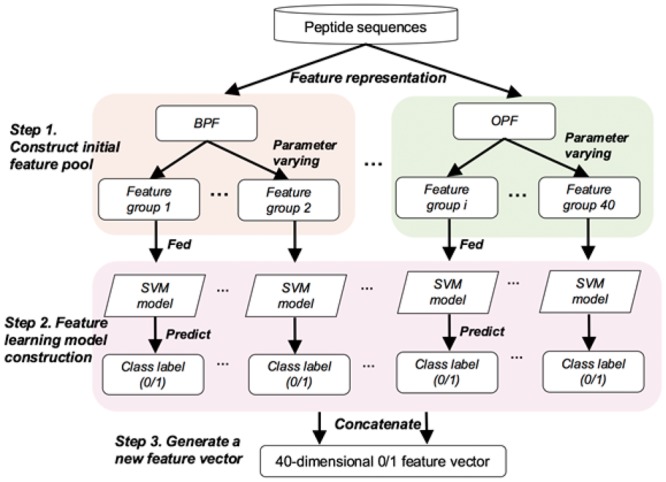
Results: To address this, we propose a novel predictor named Anti-Cancer peptide Predictor with Feature representation Learning (ACPred-FL) for accurate prediction of ACPs based on sequence information. More specifically, we develop an effective feature representation learning model, with which we can extract and learn a set of informative features from a pool of support vector machine-based models trained using sequence-based feature descriptors. By doing so, the class label information of data samples is fully utilized. To improve the feature representation, we further employ a two-step feature selection technique, resulting in a most informative five-dimensional feature vector for the final peptide representation. Experimental results show that such five features provide the most discriminative power for identifying ACPs than currently available feature descriptors, highlighting the effectiveness of the proposed feature representation learning approach. The developed ACPred-FL method significantly outperforms state-of-the-art methods.
Availability and implementation: The web-server of ACPred-FL is available at http://server.malab.cn/ACPred-FL.
Supplementary information: Supplementary data are available at Bioinformatics online.
Figures


Similar articles
-
ACPred-Fuse: fusing multi-view information improves the prediction of anticancer peptides.Brief Bioinform. 2020 Sep 25;21(5):1846-1855. doi: 10.1093/bib/bbz088. Brief Bioinform. 2020. PMID: 31729528
-
Learning embedding features based on multisense-scaled attention architecture to improve the predictive performance of anticancer peptides.Bioinformatics. 2021 Dec 11;37(24):4684-4693. doi: 10.1093/bioinformatics/btab560. Bioinformatics. 2021. PMID: 34323948
-
ACPred: A Computational Tool for the Prediction and Analysis of Anticancer Peptides.Molecules. 2019 May 22;24(10):1973. doi: 10.3390/molecules24101973. Molecules. 2019. PMID: 31121946 Free PMC article.
-
Large-scale comparative review and assessment of computational methods for anti-cancer peptide identification.Brief Bioinform. 2021 Jul 20;22(4):bbaa312. doi: 10.1093/bib/bbaa312. Brief Bioinform. 2021. PMID: 33316035 Free PMC article. Review.
-
Advancing Peptide-Based Cancer Therapy with AI: In-Depth Analysis of State-of-the-Art AI Models.J Chem Inf Model. 2024 Jul 8;64(13):4941-4957. doi: 10.1021/acs.jcim.4c00295. Epub 2024 Jun 14. J Chem Inf Model. 2024. PMID: 38874445 Review.
Cited by
-
In vitro anti-gastrointestinal cancer activity of Toxocara canis -derived peptide: Analyzing the expression level of factors related to cell proliferation and tumor growth.Front Pharmacol. 2022 Sep 20;13:878724. doi: 10.3389/fphar.2022.878724. eCollection 2022. Front Pharmacol. 2022. PMID: 36204226 Free PMC article.
-
Computational prediction and interpretation of druggable proteins using a stacked ensemble-learning framework.iScience. 2022 Aug 5;25(9):104883. doi: 10.1016/j.isci.2022.104883. eCollection 2022 Sep 16. iScience. 2022. PMID: 36046193 Free PMC article.
-
Integrating In Silico and In Vitro Approaches to Identify Natural Peptides with Selective Cytotoxicity against Cancer Cells.Int J Mol Sci. 2024 Jun 21;25(13):6848. doi: 10.3390/ijms25136848. Int J Mol Sci. 2024. PMID: 38999958 Free PMC article.
-
Accurately identifying hemagglutinin using sequence information and machine learning methods.Front Med (Lausanne). 2023 Oct 31;10:1281880. doi: 10.3389/fmed.2023.1281880. eCollection 2023. Front Med (Lausanne). 2023. PMID: 38020152 Free PMC article.
-
A Bioinformatics Tool for the Prediction of DNA N6-Methyladenine Modifications Based on Feature Fusion and Optimization Protocol.Front Bioeng Biotechnol. 2020 Jun 4;8:502. doi: 10.3389/fbioe.2020.00502. eCollection 2020. Front Bioeng Biotechnol. 2020. PMID: 32582654 Free PMC article.
References
Publication types
MeSH terms
Substances
Grants and funding
LinkOut - more resources
Full Text Sources
Other Literature Sources
