. 2018 Jun 4;113(4):26.
doi: 10.1007/s00395-018-0686-x.

Mapping macrophage polarization over the myocardial infarction time continuum

Affiliations

Mapping macrophage polarization over the myocardial infarction time continuum

Alan J Mouton et al. Basic Res Cardiol. .

Abstract

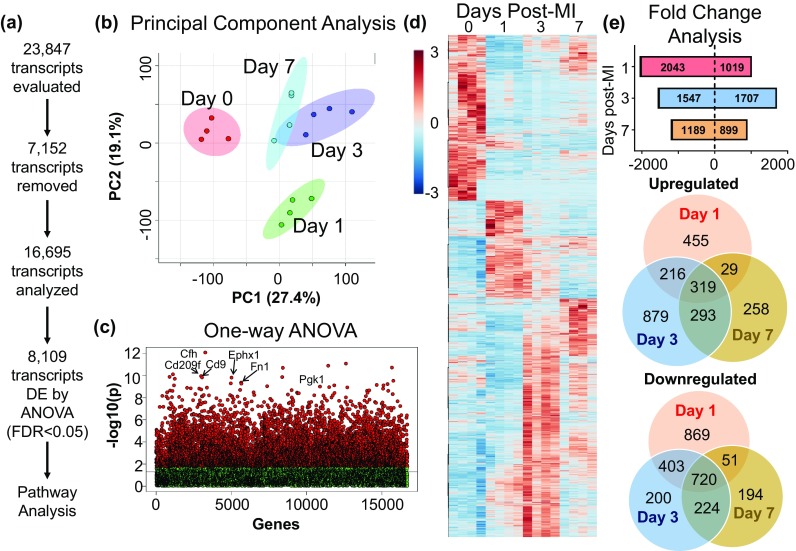
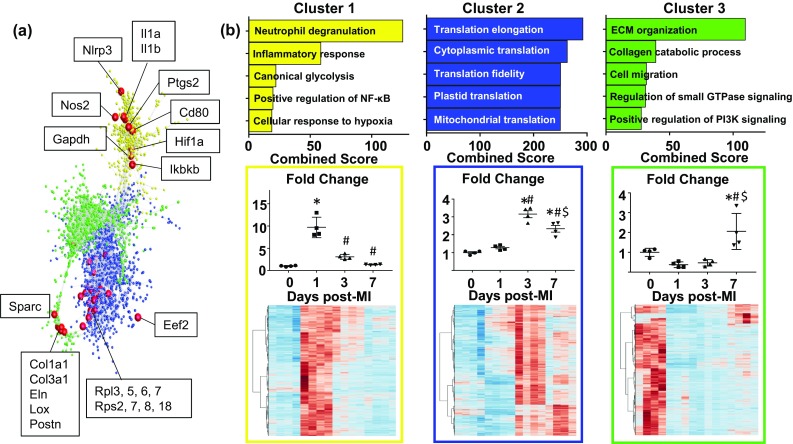
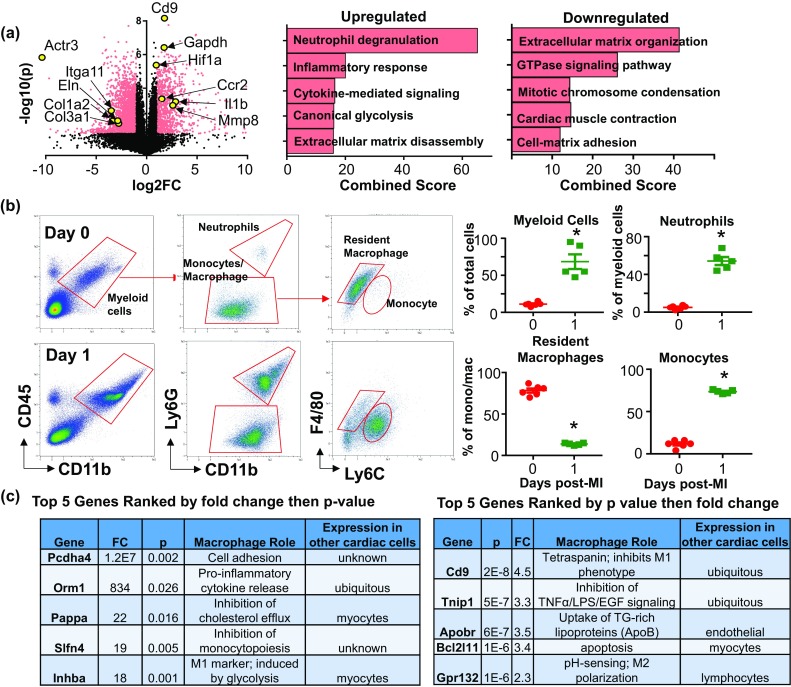
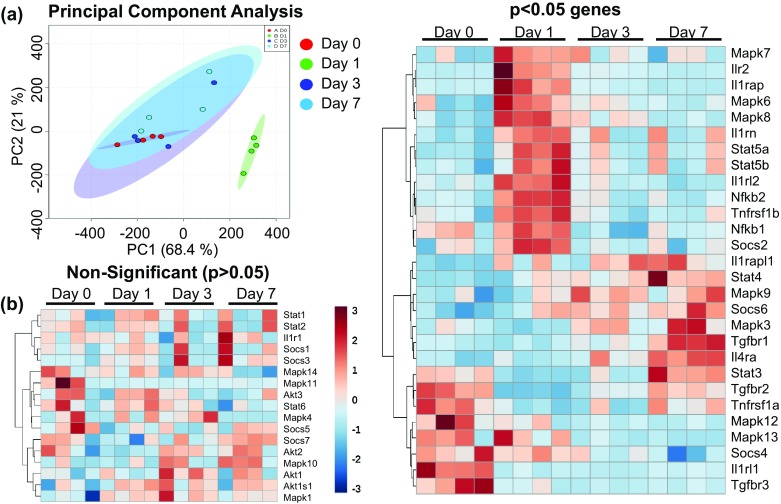
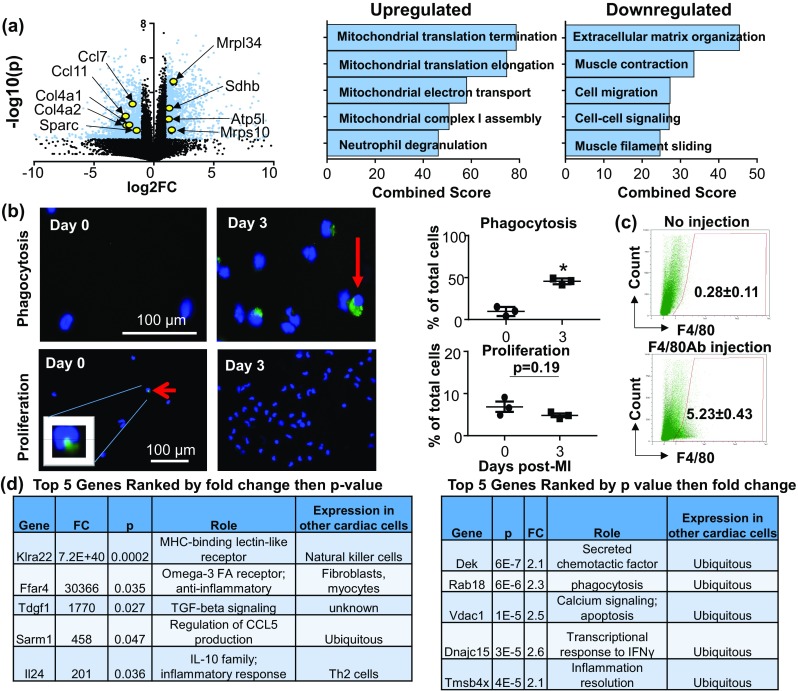
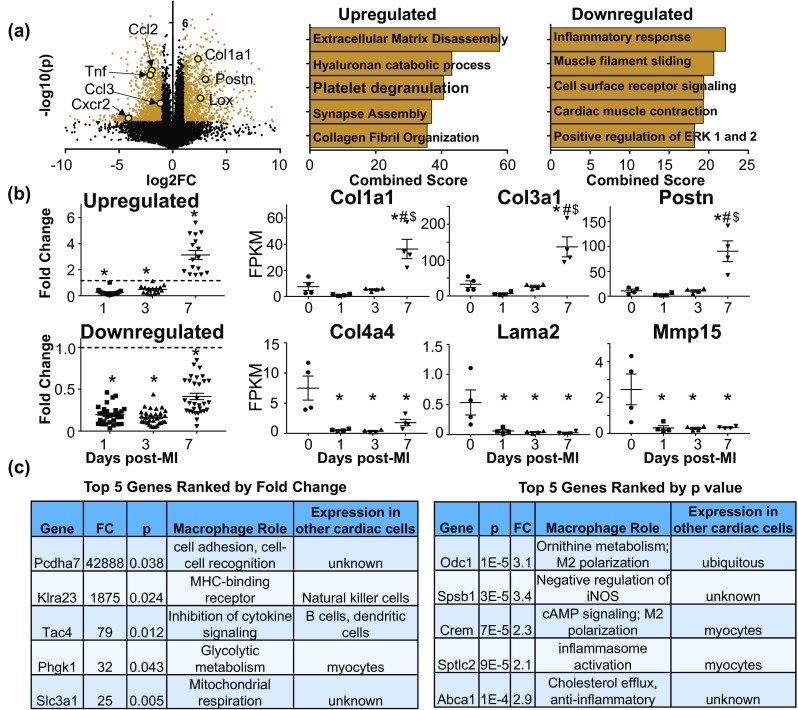
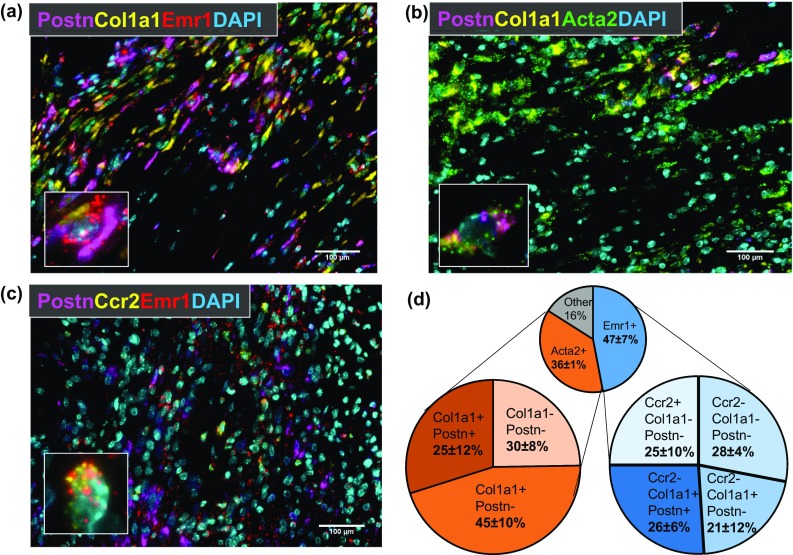
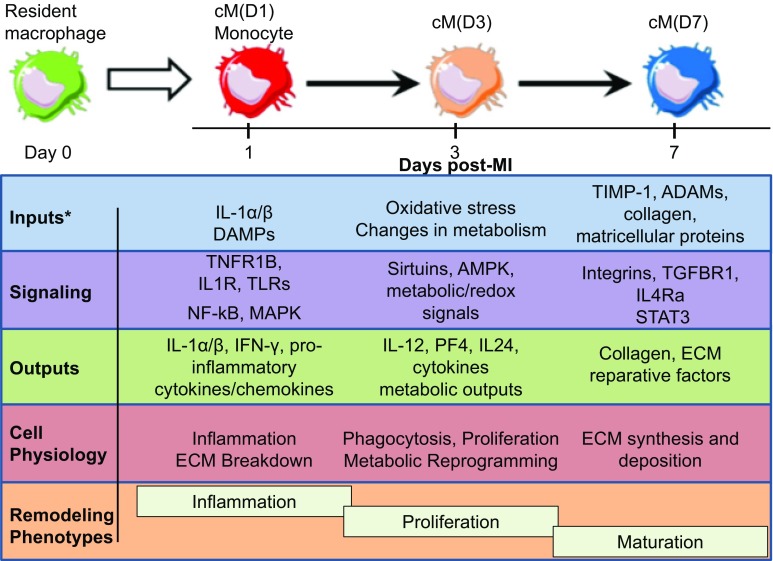
In response to myocardial infarction (MI), cardiac macrophages regulate inflammation and scar formation. We hypothesized that macrophages undergo polarization state changes over the MI time course and assessed macrophage polarization transcriptomic signatures over the first week of MI. C57BL/6 J male mice (3-6 months old) were subjected to permanent coronary artery ligation to induce MI, and macrophages were isolated from the infarct region at days 1, 3, and 7 post-MI. Day 0, no MI resident cardiac macrophages served as the negative MI control. Whole transcriptome analysis was performed using RNA-sequencing on n = 4 pooled sets for each time. Day 1 macrophages displayed a unique pro-inflammatory, extracellular matrix (ECM)-degrading signature. By flow cytometry, day 0 macrophages were largely F4/80highLy6Clow resident macrophages, whereas day 1 macrophages were largely F4/80lowLy6Chigh infiltrating monocytes. Day 3 macrophages exhibited increased proliferation and phagocytosis, and expression of genes related to mitochondrial function and oxidative phosphorylation, indicative of metabolic reprogramming. Day 7 macrophages displayed a pro-reparative signature enriched for genes involved in ECM remodeling and scar formation. By triple in situ hybridization, day 7 infarct macrophages in vivo expressed collagen I and periostin mRNA. Our results indicate macrophages show distinct gene expression profiles over the first week of MI, with metabolic reprogramming important for polarization. In addition to serving as indirect mediators of ECM remodeling, macrophages are a direct source of ECM components. Our study is the first to report the detailed changes in the macrophage transcriptome over the first week of MI.

Keywords: LV remodeling; Macrophage; Myocardial infarction; RNA-Seq; Transcriptome.


Figures

Fig. 1
Fig. 1
Distinct time-dependent gene expression profiles in post-MI macrophages. a Of 23,847 genes sequenced, 7152 did not meet quality control standards and were removed. Of the remaining 16,695 genes, 8109 were differentially expressed (DE) by one-way ANOVA (FDR adjusted p value < 0.05). b Macrophages from different post-MI days analyzed by principal component analysis. Day 1 macrophages were most distinct from the other times. Day 3 and 7 macrophages were distinct from day 0 and day 1 and showed overlap. c One-way ANOVA plot showing significant genes in red and d heat map of all differentially expressed genes. e Fold change analysis of differentially expressed genes at each day post-MI (fold change threshold of 2, FDR adjusted p value < 0.05) and Venn diagrams of upregulated and downregulated genes showing distinction and overlap in gene expression among the times
Fig. 2
Fig. 2
Gene expression pattern clustering. a Markov clustering analysis generated three distinct major clusters representing different post-MI gene expression patterns. Each node represents a single gene, and genes within the same cluster (color) show similar gene expression patterns. Genes representing each cluster are highlighted in red. b Enrichment analysis and expression patterns for each cluster. Cluster 1 (yellow) contained 565 genes increased at day 1 and was enriched for pro-inflammatory processes. Cluster 2 genes (blue, 1965 genes) were increased at day 3 and 7 and were enriched for translation processes. Cluster 3 (green, 1222 genes) were increased at day 7 and enriched for ECM processes. *p < 0.05 versus day 0, #p < 0.05 versus day 1, $p < 0.05 versus day 3
Fig. 3
Fig. 3
Day 1 post-MI macrophages showed a pro-inflammatory profile. a Volcano plot with all values normalized to day 0 no MI controls and representative genes highlighted (left). Enrichment analysis of upregulated and downregulated genes (right). b Flow cytometry analysis of macrophage cell surface markers. At day 1 post-MI, total myeloid cells, neutrophils, and monocytes significantly increased in the infarct region, while resident macrophages decreased. c Top five upregulated day 1 post-MI genes ranked by fold change (left) and p value (right). *p < 0.05 versus day 0
Fig. 4
Fig. 4
Post-MI macrophage signaling profiles. a Principal component analysis of genes involved in ubiquitous signaling pathways indicates that day 1 macrophages display a unique signaling profile compared to days 0, 3, and 7. b Heat maps grouped by significance (left, non-significant genes (p > 0.05); right, significant genes (p < 0.05) by unpaired two-tailed t test)
Fig. 5
Fig. 5
Day 3 post-MI macrophages showed a phagocytic, proliferative, and metabolic reprogramming profile. a Volcano plot with representative genes highlighted and enrichment analysis of upregulated and downregulated genes. All values are normalized to day 0 no MI controls and representative genes are highlighted. b Representative images of phagocytic (top) and proliferative (bottom) macrophages. Phagocytic capacity significantly increased at day 3 post-MI, whereas proliferation was similar to day 0. c In vivo turnover. At day 3 post-MI, ~ 5% of macrophages were remaining from day 1. d Top five upregulated day1 genes ranked by fold change (left) and p value (right). *p < 0.05 versus day 0
Fig. 6
Fig. 6
Day 7 post-MI macrophages showed a pro-reparative profile. a Volcano plot with representative genes highlighted and enrichment analysis of upregulated and downregulated genes. All values are normalized to day 0 no MI controls and representative genes are highlighted. b ECM genes that clustered together. Fold change values for genes upregulated at day 7 compared to day 1 and 3 post-MI (top) or remained downregulated at day 7 (bottom). c Top five upregulated day 7 genes ranked by fold change (left) and p value (right). *p < 0.05 versus day 0, #p < 0.05 versus day 1, $p < 0.05 versus day 3
Fig. 7
Fig. 7
Macrophage expression of Col1a1 and Postn in LV infarct region. Numbers of cells expressing Postn and Col1a1 mRNA in LV infarct tissue at day 7 post-MI were determined by in situ hybridization. Both Emr1 (a; red, Cy5, macrophages) and Acta2 (b; green, Cy5, fibroblasts) positive cells were assessed for expression of Col1a1 (yellow, Cy3) and Postn (magenta, FITC). Emr1 and Ccr2 positive cells (c; yellow, Cy3) were assessed for expression of Postn (magenta, FITC). d Pie charts displaying proportion of LV infarct Emr1 + (macrophages) and Acta2 + (fibroblasts) cells expressing Col1a1 and Postn. Nuclei are stained with DAPI (cyan)
Fig. 8
Fig. 8
Map of macrophage polarization over the MI time continuum. Post-MI macrophage profiles in terms of inputs, signaling, outputs, and cell physiology over the three major post-MI remodeling phases (inflammation, proliferation, and scar maturation). DAMPs damage-associated molecular patterns, ECM extracellular matrix

References

    1. Aarup A, Pedersen TX, Junker N, Christoffersen C, Bartels ED, Madsen M, Nielsen CH, Nielsen LB. Hypoxia-inducible factor-1alpha expression in macrophages promotes development of atherosclerosis. Arterioscler Thromb Vasc Biol. 2016;36:1782–1790. doi: 10.1161/ATVBAHA.116.307830. - DOI - PubMed
    1. Aredo B, Li T, Chen X, Zhang K, Wang CX, Gou D, Zhao B, He Y, Ufret-Vincenty RL. A chimeric Cfh transgene leads to increased retinal oxidative stress, inflammation, and accumulation of activated subretinal microglia in mice. Invest Ophthalmol Vis Sci. 2015;56:3427–3440. doi: 10.1167/iovs.14-16089. - DOI - PMC - PubMed
    1. Berger A, Tran AH, Paige CJ. Co-regulated decrease of Neurokinin-1 receptor and Hemokinin-1 gene expression in monocytes and macrophages after activation with pro-inflammatory cytokines. J Neuroimmunol. 2007;187:83–93. doi: 10.1016/j.jneuroim.2007.04.019. - DOI - PubMed
    1. Bolick DT, Skaflen MD, Johnson LE, Kwon SC, Howatt D, Daugherty A, Ravichandran KS, Hedrick CC. G2A deficiency in mice promotes macrophage activation and atherosclerosis. Circ Res. 2009;104:318–327. doi: 10.1161/CIRCRESAHA.108.181131. - DOI - PMC - PubMed
    1. Camell CD, Nguyen KY, Jurczak MJ, Christian BE, Shulman GI, Shadel GS, Dixit VD. Macrophage-specific de novo synthesis of ceramide is dispensable for inflammasome-driven inflammation and insulin resistance in obesity. J Biol Chem. 2015;290:29402–29413. doi: 10.1074/jbc.M115.680199. - DOI - PMC - PubMed

Publication types

MeSH terms

Substances