. 2018 Jun 5:7:e37623.
doi: 10.7554/eLife.37623.

Temporal profiling of redox-dependent heterogeneity in single cells

Affiliations

Temporal profiling of redox-dependent heterogeneity in single cells

Meytal Radzinski et al. Elife. .

Abstract

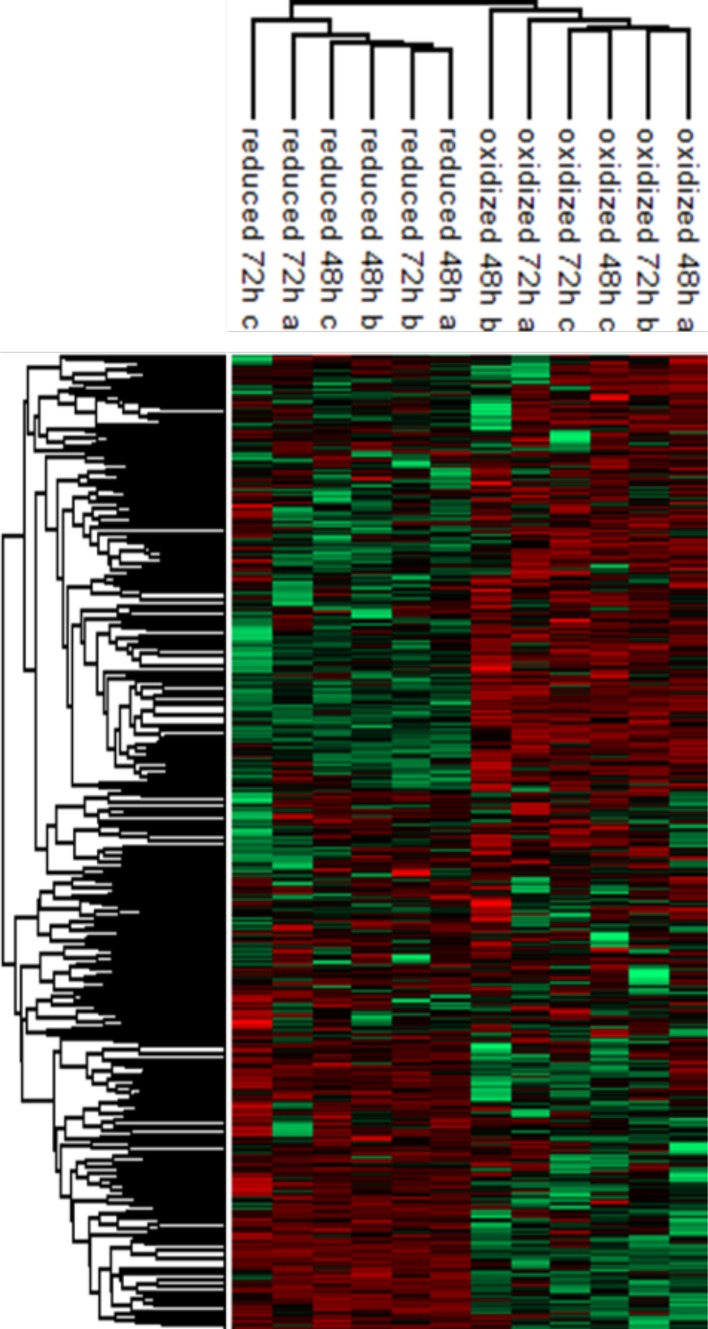
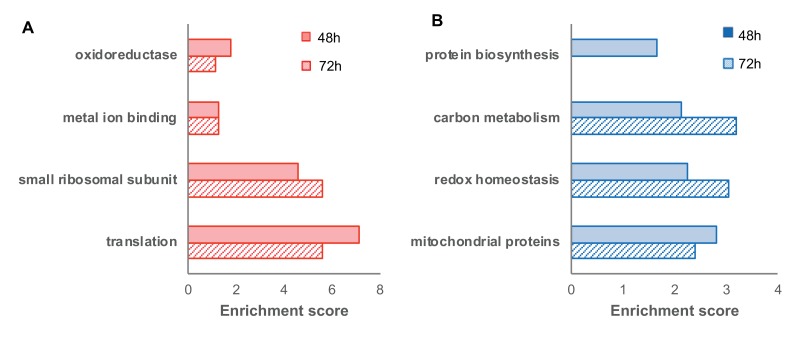
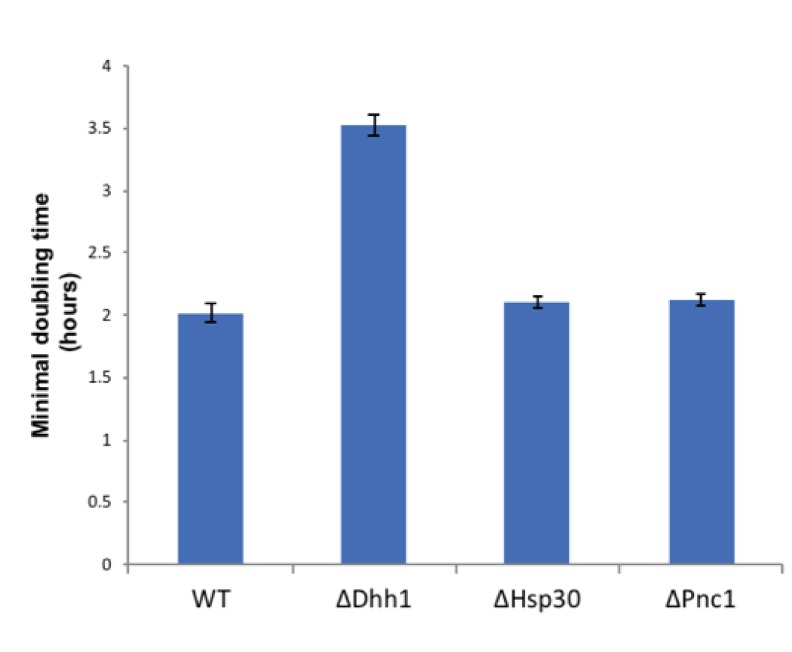
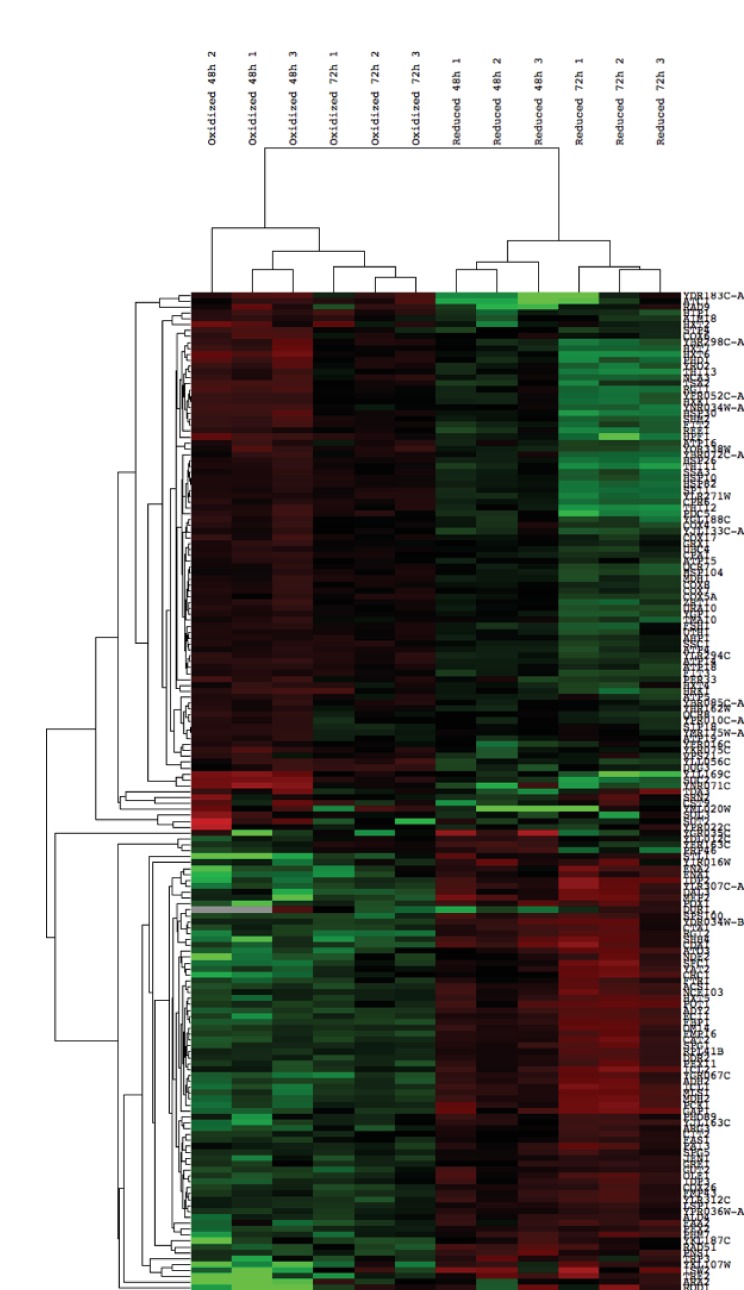
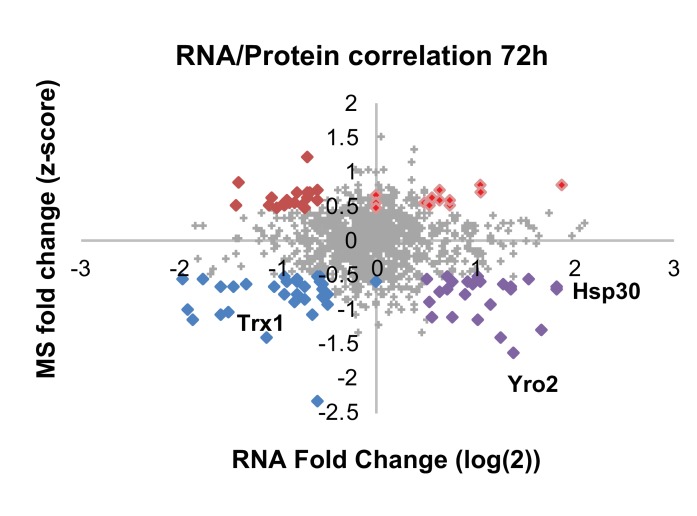
Cellular redox status affects diverse cellular functions, including proliferation, protein homeostasis, and aging. Thus, individual differences in redox status can give rise to distinct sub-populations even among cells with identical genetic backgrounds. Here, we have created a novel methodology to track redox status at single cell resolution using the redox-sensitive probe Grx1-roGFP2. Our method allows identification and sorting of sub-populations with different oxidation levels in either the cytosol, mitochondria or peroxisomes. Using this approach, we defined a redox-dependent heterogeneity of yeast cells and characterized growth, as well as proteomic and transcriptomic profiles of distinctive redox subpopulations. We report that, starting in late logarithmic growth, cells of the same age have a bi-modal distribution of oxidation status. A comparative proteomic analysis between these populations identified three key proteins, Hsp30, Dhh1, and Pnc1, which affect basal oxidation levels and may serve as first line of defense proteins in redox homeostasis.

Keywords: S. cerevisiae; biochemistry; cell biology; chemical biology; redox biology; redox sensors; roGFP; yeast.


Conflict of interest statement

MR, RF, OY, WB, NS, JG, SI, YG, ST, YN, TR, NF, MS, DR No competing interests declared

Figures

Figure 1.
Figure 1.. Monitoring subcellular redox levels in yeast cells using the Grx1-roGFP2 variants and flow cytometry.
(A) Schematic of the Grx1-roGFP2 variant used in this study to monitor oxidation in the cytosol. Cellular GSSG reacts with the catalytic residues of the fused Grx1 which leads to oxidation of the modified GFP protein. (B) Fluorescence excitation spectra of Grx1-roGFP2 in fully reduced (blue) and fully oxidized (red) yeast cells. Emission followed at 510 nm. (C–D) Quantification of redox status of fully reduced (blue) and fully oxidized (red) cells using FACS. (C) Fluorescence of Grx1-roGFP2 at 510 nm obtained using excitation by 405mn and 488 nm lasers. (D) Distribution of the 405/488 nm ratios among fully reduced and fully oxidized cells.
Figure 1—figure supplement 1.
Figure 1—figure supplement 1.. Representation of FACS subpopulation gates.
(A) Representative data of an unsorted sample after 24 hr growth, plotted by the ratio between excitation at 405 and 488 nm (y and x axis, respectively). ‘GFP’ corresponds with the ‘reduced’ gate, while ‘410’ corresponds with the oxidized. (B–C) Representative data of a fully oxidized or reduced sample (respectively).
Figure 1—figure supplement 2.
Figure 1—figure supplement 2.. Linear characterization of (A) peroxisomal and (B) mitochondrial ‘oxidation gate’.
Quantification of the redox status of fully reduced (blue) and fully oxidized (red) cells using FACS, using the peroxisomal and mitochondrial sensors.
Figure 2.
Figure 2.. Both cytosolic and mitochondrial oxidation levels increase with age and indicate the emergence of oxidized and reduced cellular subpopulations.
Cells expressing cytosolic Grx1-roGFP2 (A) or mitochondrial Grx1-roGFP2-Su9 (B) probes in wild type cells were grown for four days and their oxidation level monitored. In each experiment 10,000 cells were measured. Shown are oxidation changes over four days in both the cytosol and mitochondria. (C) Bi-modal distribution of ratios of fluorescence intensities obtained at 405 and 488 nm in yeast samples of different ages (24, 48, 72, and 96 hr), pursuant to Figure 1D. A peak at ratio ≤1 represents the reduced subpopulation, while ≥6 represents the oxidized subpopulation.
Figure 2—figure supplement 1.
Figure 2—figure supplement 1.. Representative examples of OxD distribution curves at 24, 48, and 72 hr, in contrast to 405/488 nm ratios shown in Figure 2.
Normalization was calculated using median fluorescence values of 10,000 DTT- and diamide-treated cells. This normalization masks the actual fluorescence of the average population and natural variation between different cells, leading to an imbalanced and non-representative OxD scale. However, the same curve trends may be seen as those displayed in the unbiased 405/488 nm ratios in Figure 2, with a bimodal distribution during chronological aging.
Figure 3.
Figure 3.. Growth and division of reduced and oxidized subpopulations of yeast cells after sorting by FACS.
(A) Differences in minimal doubling time between the sorted oxidized and reduced subpopulations at different time points (48, 72, and 96 hr) measured by OD600 in a plate reader. (B) Corresponding duration of the lag phase during recovery growth, measured by plate reader. (C) Corresponding differences in average number of budding scars counted in sorted oxidized and reduced subpopulations, as assessed by confocal microscopy.
Figure 4.
Figure 4.. Differential respiration profile of reduced and oxidized subpopulations after sorting by FACS.
(A) Normalized oxygen consumption rate (OCR) of reduced and oxidized yeast populations. (B) Normalized extracellular acidification rate (ECAR) of reduced and oxidized yeast populations. Three biological replicates with an identical number of cells were analyzed for each measurement.
Figure 5.
Figure 5.. Correlation between redox status and replicative aging.
(A) Schematic of mother enrichment program in yeast, using estradiol induction for daughter cell death, growth, and flow cytometry analysis of both bud scar counts and oxidation level. (B) Representative histogram of low and high bud scar subpopulations during early growth. Within the histogram, p1 represents the subset of the population with a higher number of bud scars, while p3 a lower. In table: The fraction of cells belonging to the Grx1-roGFP2-determined reduced or oxidized subpopulations changes according to bud scar count, with an enrichment for oxidized cells within the more highly divided subpopulation. (C) Distribution of the ratios of fluorescence intensities obtained at 405 and 488 nm among the low bud scar subpopulation at early growth, with a strong peak in reduced ratios. (D) Distribution of the ratios of fluorescence intensities obtained at 405 and 488 nm among the high bud scar subpopulation at early growth, with a wide peak around oxidized ratios of varying degrees. (E) Representative histogram of low and high bud scar subpopulations during late growth. Within the histogram, p1 represents the subset of the population with a higher number of bud scars, while p3 a lower. At late growth, the entire population displays an enrichment for oxidized cells, while the low bud scar subpopulation nonetheless contains a higher fraction of reduced cells. (F) Distribution of the ratios of fluorescence intensities obtained at 405 and 488 nm among the low bud scar subpopulation at late growth, with a bimodal distribution between oxidized and reduced ratios. (G) Distribution of the ratios of fluorescence intensities obtained at 405 and 488 nm among the high bud scar subpopulation at late growth, with a strong peak around oxidized ratios.
Figure 6.
Figure 6.. Proteomic analysis and functional enrichment analysis of the reduced and oxidized subpopulations.
(A) Hierarchical clustering of proteins identified in cells sorted from cultures at different time points (48 and 72 hr); downregulated proteins are in green, up-regulated are in red. (B) Functional enrichment analysis of the two largest differentially expressed clusters (3 and 10, representing enriched functions in the reduced and oxidized subpopulations, respectively) at 48 and 72 hr (solid fill and slashes, respectively). (C) Volcano plot of differentially expressed proteins between the reduced and oxidized subpopulations. Significantly expressed proteins are labeled in blue (increased expression in reduced) and red (increased expression in oxidized), according to an FDR of 0.05 and a fold change greater than 2.
Figure 6—figure supplement 1.
Figure 6—figure supplement 1.. Cellular localization annotation of all identified proteins (in at least two repeats within all four subpopulations).
Annotation of all identified proteins, corresponding with the localization as agreed upon in the literature.
Figure 6—figure supplement 2.
Figure 6—figure supplement 2.. Hierarchical clustering of the protein abundances.
log2 values of the log2 (LFQ) values of proteins identified in each post-sorting samples harvested at 48 and 72 hr (red corresponding to higher expression, green to lower). Median intensities were calculated and clustered in Figure 5A.
Figure 6—figure supplement 3.
Figure 6—figure supplement 3.. Functional enrichment of differentially expressed proteins (FDR < 0.05) in the oxidized (red) and reduced (blue) subpopulations (corresponding to the volcano plot in Figure 6).
Figure 7.
Figure 7.. Analysis of differentially expressed proteins between the reduced and oxidized subpopulations.
(A) Oxidation levels in deletion strains of significantly changed proteins (tsa2, dhh1, pnc1, hsp30, and wild type control) at different ages (24, 48, and 72 hr). (B) Differences in cell growth between deletion strains. dhh1 has clearly enlarged vacuoles as compared to other strains (emphasized), while pnc1 is uniquely small in comparison with the wild type. hsp30 presents largely similar to the wild type, with bimodal variation between different cells. (C–F) Distribution of fluorescence intensity ratios obtained at 405 and 488 nm of deletion strains. (C) Distribution of tsa2, which follows a wild type-like gradual shift towards more highly oxidized ratios. (D) Distribution of dhh1, which begins from a slightly higher redox ratio and undergoes a collapse at 72 hr. (E) Distribution of pnc1, a protein upregulated in the oxidized subpopulation, which remains highly reduced as compared to the wild type. (F) Bi-modal distribution of hsp30, with little variation over time.
Figure 7—figure supplement 1.
Figure 7—figure supplement 1.. (A–C) Association maps of proteins associated with Dhh1, Pnc1, and Hsp30 (respectively), as identified in the mass spectrometry screen of differentially expressed proteins between the reduced (blue) and oxidized (red) subpopulations.
Protein associations are based on the STRING database (as of January 2017), under the highest confidence interaction and default active interaction sources. Visualization was done by using Cytoscape. (D) Average OxD values of Hsp30-associated gene deletion strains at 24 and 48 hr.
Figure 7—figure supplement 2.
Figure 7—figure supplement 2.. Dhh1 deletion decreases cell growth.
Minimal doubling times of wild type and deletion strains (Δdhh1, Δhsp30, Δpnc1) grown for 16 hr in casein supplemented medium, OD600 was measured in plate reader as described in Materials and methods. Hsp30 and Pnc1 deletion did not affect growth of cells relative to the wild type.
Figure 7—figure supplement 3.
Figure 7—figure supplement 3.. Oxidation in mitochondria detected by mitochondrial sensor Su9 expressed in wild type, Hsp30 and Pnc1 knockout strains.
(A) Degree of mitochondrial oxidation (OxD) in yeast samples of different ages (24 and 48 hr), (B-D) Distribution of fluorescence intensity ratios obtained at 405 and 488 nm of wild type (B), Δhsp30 (C) and Δpnc1 (D) strains from different ages (24 and 48 hr). The analysis was done using 4–6 replicates. The Δdhh1 strain showed very low intensity fluorescence, therefore was not analyzed. Moreover, the Su9-GFP florescence deceased dramatically after 48 hr growth, therefore older samples were not analyzed.
Figure 7—figure supplement 4.
Figure 7—figure supplement 4.. Oxidation in peroxisome detected by peroxisomal sensor SKL-roGFP expressed in wild type, dhh1, hsp30 and pnc1 knockout strains.
(A) Degree of peroxisomal oxidation (OxD) in yeast samples after growth in standard medium for 24 hr. The analysis was done using 5–6 replicates. (B-E) Distribution of fluorescence intensity ratios obtained at 405 nm and 488 nm of wild type (B), Δdhh1 (C) Δhsp30 (D) and Δpnc1 (E) strains. The analysis was done using three replicates. The Δdhh1 strain showed very low intensity fluorescence, therefore was not analyzed. Moreover, the SKL-GFP florescence reached maximal value after 48 hr growth in all strains, therefore older samples were not analyzed.
Figure 8.
Figure 8.. Differentially expressed transcripts between the reduced and oxidized subpopulations.
(A) Hierarchical clustering of the median expression values of all differentially expressed genes (FDR < 0.05) identified in the post-sorting cells harvested at different time points (48 and 72 hr); downregulated transcripts are in green, up-regulated are in red. Each row was normalized by its median and the log2 value was taken for visualization purposes. The data was clustered using a centered correlation similarity metric. (B) Functional enrichment analysis of the differentially expressed transcripts in the reduced (blue) and oxidized (red) subpopulations harvested after 48 hr (solid bars) and 72 hr (solid fill and slashes, respectively). (C) Correlation plot between mRNA and protein expression at 48 hr. Significantly differentially regulated proteins are emphasized in bold and color according to their coupling status (bright red – coupled upregulation in oxidized subpopulation, dark red – uncoupled protein upregulation in oxidized subpopulation, blue – coupled upregulation in reduced subpopulation, purple – uncoupled protein upregulation in reduced subpopulation). (D) The mean value of normalized counts (log2) is plotted for each gene. Each point is colored according to the adjusted value of the differential expression analysis (Materials amd methods). Hsp30, Yro2 and Tsa2 were significantly upregulated in the oxidized cells.
Figure 8—figure supplement 1.
Figure 8—figure supplement 1.. Hierarchical clustering of expression values of all differentially expressed genes (FDR < 0.05) identified in the biological replicates of the post-sorting cells harvested at 48 and 72 hr.
Transcripts above the median value of the row are in green, below in red. Each row was normalized by its median and log was taken for visualization purposes. The data was clustered using centered correlation similarity metric.
Figure 8—figure supplement 2.
Figure 8—figure supplement 2.. Correlation plot between mRNA and protein expression at 72 hr.
Significantly differentially regulated proteins are emphasized in bold and color according to their coupling status (bright red – coupled upregulation in oxidized subpopulation, dark red – uncoupled protein upregulation in oxidized subpopulation, blue – coupled upregulation in reduced subpopulation, purple – uncoupled protein upregulation in reduced subpopulation). Values that fall on the axis reflect transcripts that were present in only one population leading to an infinite fold change, here replaced with ‘zero’.
Figure 9.
Figure 9.. Changes in oxidative status of individual cells over time under confocal microscopy.
(A) Oxidation over time of a single cell, from reduced to highly oxidized, imaged using confocal microscopy. (B) Samples treated with 40 mM DTT and 8 mM Diamide for 15 min and imaged using confocal microscopy. (C–F) Oxidation of thirty unique single cells over 12 hr, clustered by trajectory similarity (labeled in red).
Figure 10.
Figure 10.. Changes in oxidative status between mother and daughter cells over time under confocal microscopy.
(A–C) Oxidation levels over time in mother and respective daughter cells during and after budding, showing the shared oxidative status until separation.

References

    1. Ackermann M. A functional perspective on phenotypic heterogeneity in microorganisms. Nature Reviews Microbiology. 2015;13:497–508. doi: 10.1038/nrmicro3491. - DOI - PubMed
    1. Altschuler SJ, Wu LF, Lf W. Cellular heterogeneity: do differences make a difference? Cell. 2010;141:559–563. doi: 10.1016/j.cell.2010.04.033. - DOI - PMC - PubMed
    1. Anders S, Huber W. Differential expression analysis for sequence count data. Genome Biology. 2010;11:R106. doi: 10.1186/gb-2010-11-10-r106. - DOI - PMC - PubMed
    1. Anderson RM, Bitterman KJ, Wood JG, Medvedik O, Sinclair DA. Nicotinamide and PNC1 govern lifespan extension by calorie restriction in Saccharomyces cerevisiae. Nature. 2003;423:181–185. doi: 10.1038/nature01578. - DOI - PMC - PubMed
    1. Avery SV. Microbial cell individuality and the underlying sources of heterogeneity. Nature Reviews Microbiology. 2006;4:577–587. doi: 10.1038/nrmicro1460. - DOI - PubMed

Publication types

MeSH terms