

Multiplexed Targeting of Barrett's Neoplasia with a Heterobivalent Ligand: Imaging Study on Mouse Xenograft in Vivo and Human Specimens ex Vivo
- PMID: 29870260
- PMCID: PMC6542277
- DOI: 10.1021/acs.jmedchem.8b00405
Multiplexed Targeting of Barrett's Neoplasia with a Heterobivalent Ligand: Imaging Study on Mouse Xenograft in Vivo and Human Specimens ex Vivo
Abstract
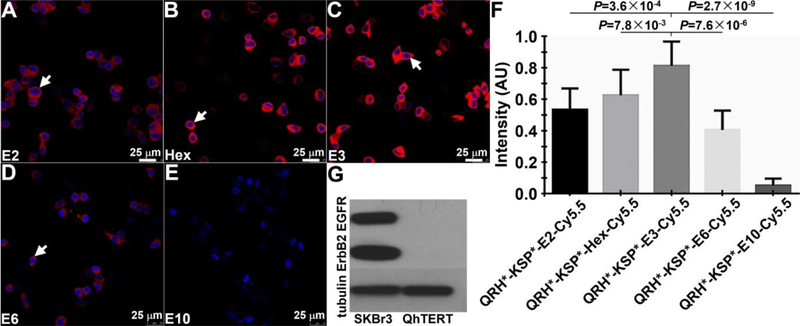
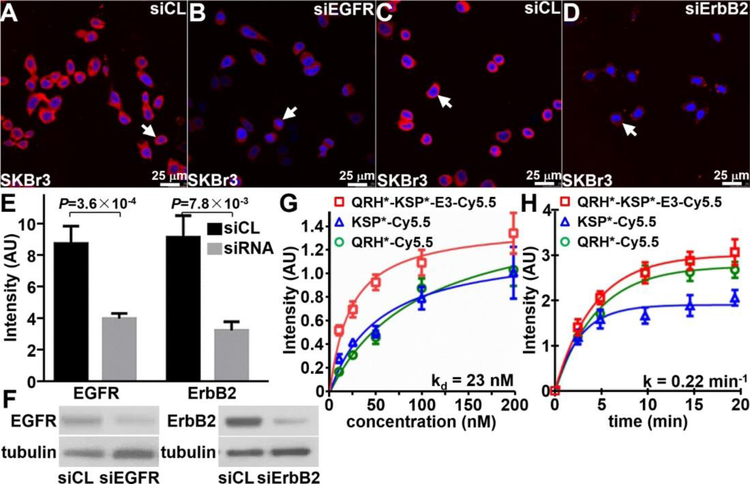
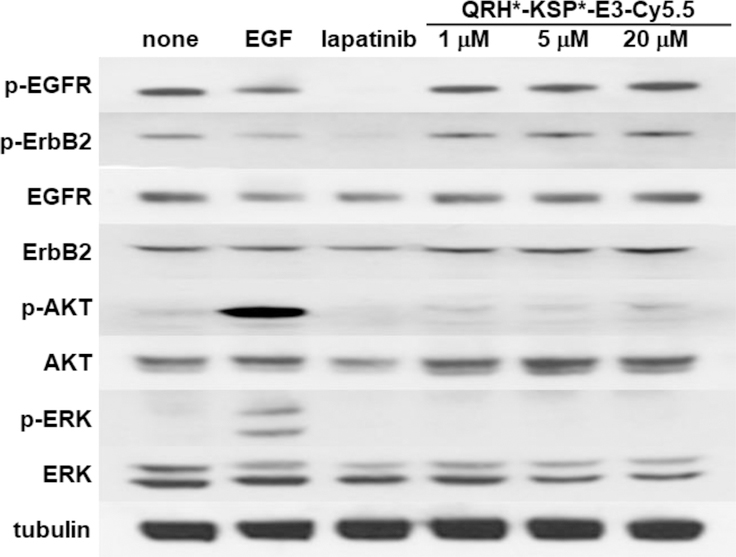
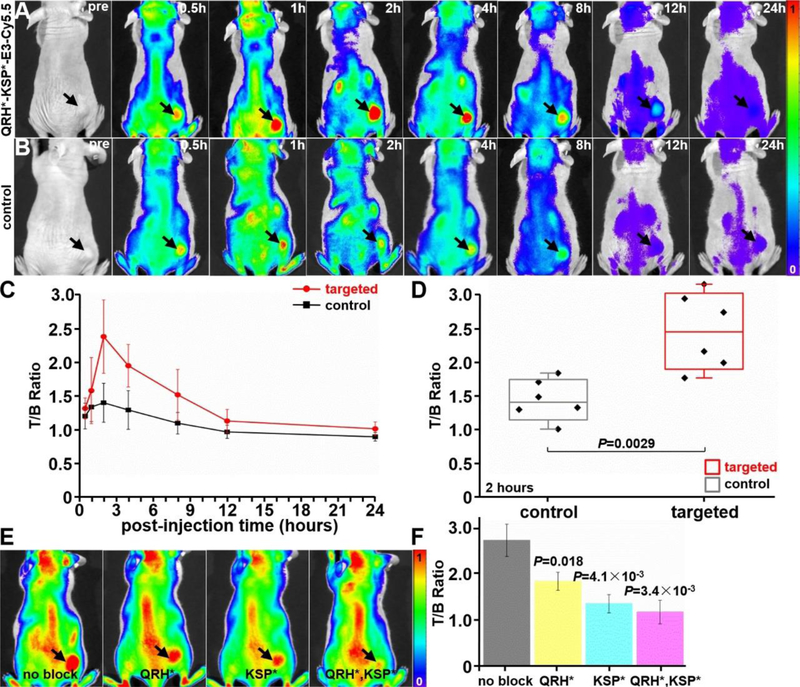
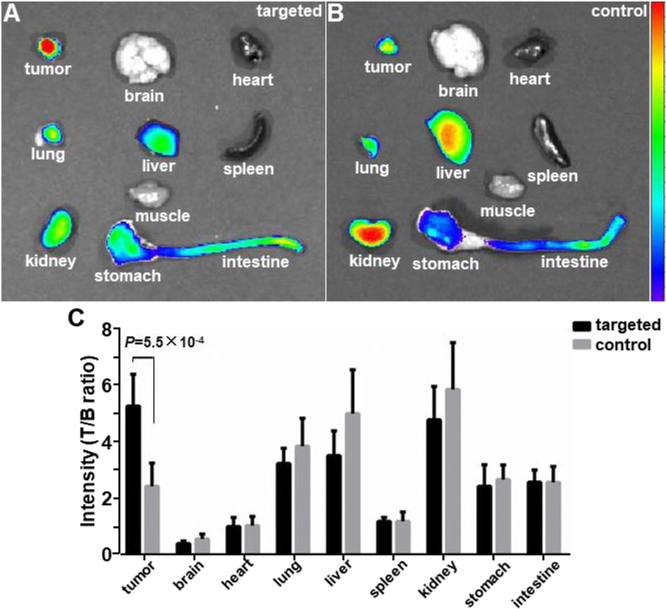
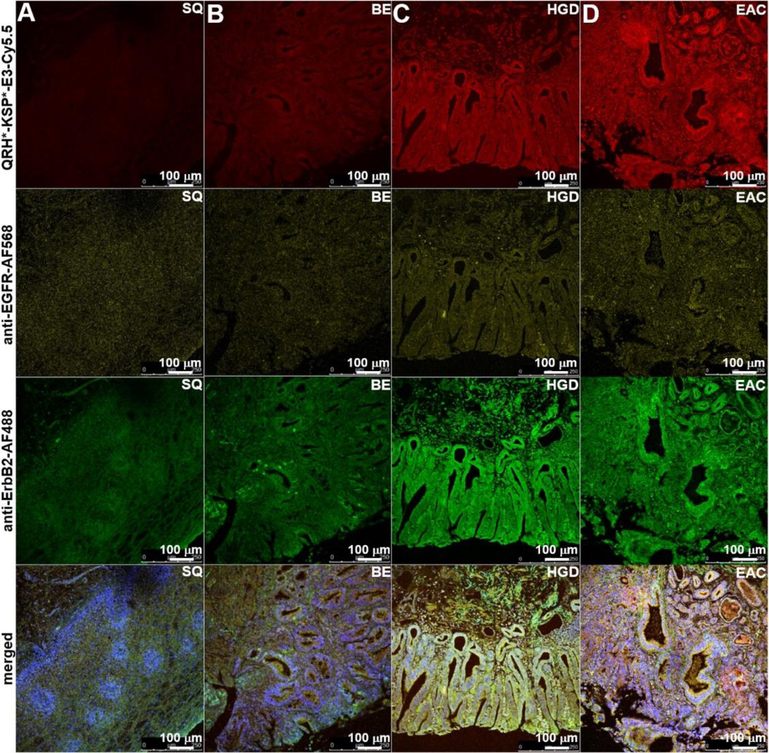
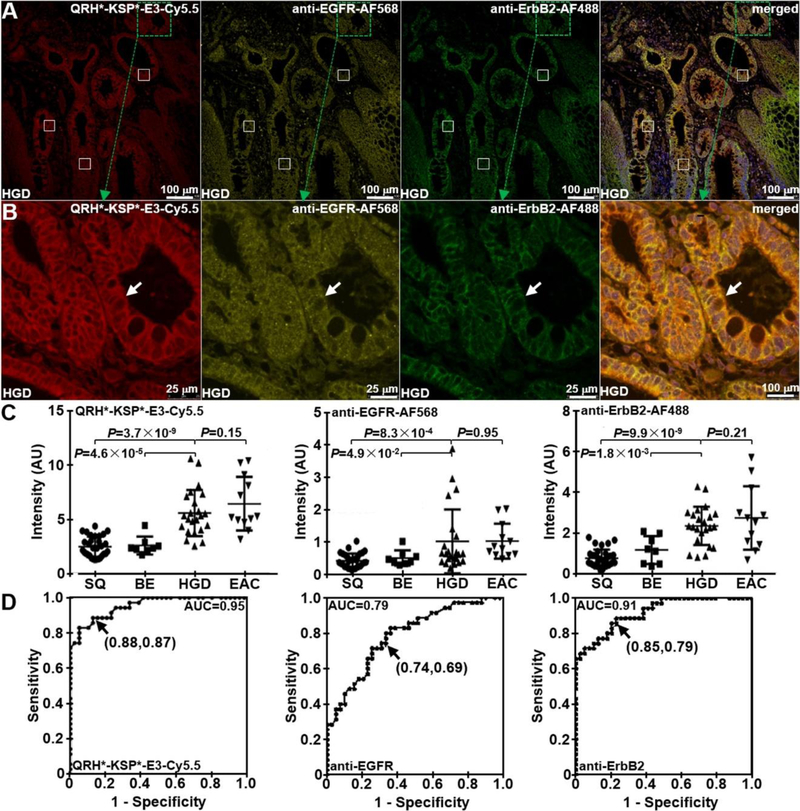
Esophageal adenocarcinoma (EAC) is a molecularly heterogeneous disease that is rising rapidly in incidence and has poor prognosis. We developed a heterobivalent peptide to target detection of early Barrett's neoplasia by combining monomer heptapeptides specific for either EGFR or ErbB2 in a heterodimer configuration. The structure of a triethylene glycol linker was optimized to maximize binding interactions to the surface receptors on cells. The Cy5.5-labeled heterodimer QRH*-KSP*-E3-Cy5.5 demonstrated specific binding to each target and showed 3-fold greater fluorescence intensity and 2-fold higher affinity compared with those of either monomer alone. Peak uptake in xenograft tumors was observed at 2 h postinjection with systemic clearance by ∼24 h in vivo. Furthermore, ligand binding was evaluated on human esophageal specimens ex vivo, and 88% sensitivity and 87% specificity were found for the detection of either high-grade dysplasia (HGD) or EAC. This peptide heterodimer shows promise for targeted detection of early Barrett's neoplasia in clinical study.
Conflict of interest statement
Conflict of interest
Authors (JC, JZ, BPJ, TDW) are inventors on patents filed by the University of Michigan on the peptides used in this study. The other authors disclose no conflicts.
Figures

Similar articles
-
Detection of Barrett's neoplasia with a near-infrared fluorescent heterodimeric peptide.Endoscopy. 2022 Dec;54(12):1198-1204. doi: 10.1055/a-1801-2406. Epub 2022 Mar 17. Endoscopy. 2022. PMID: 35299273 Free PMC article. Clinical Trial.
-
Multiplexed endoscopic imaging of Barrett's neoplasia using targeted fluorescent heptapeptides in a phase 1 proof-of-concept study.Gut. 2021 Jun;70(6):1010-1013. doi: 10.1136/gutjnl-2020-322945. Epub 2020 Oct 7. Gut. 2021. PMID: 33028666 Free PMC article. Clinical Trial. No abstract available.
-
Volumetric laser endomicroscopy in the management of Barrett's esophagus.Curr Opin Gastroenterol. 2017 Jul;33(4):254-260. doi: 10.1097/MOG.0000000000000366. Curr Opin Gastroenterol. 2017. PMID: 28402993 Review.
-
Progression from low-grade dysplasia to malignancy in patients with Barrett's esophagus diagnosed by two or more pathologists.World J Gastroenterol. 2016 Oct 21;22(39):8831-8843. doi: 10.3748/wjg.v22.i39.8831. World J Gastroenterol. 2016. PMID: 27818599 Free PMC article.
-
Multimodal endoscope can quantify wide-field fluorescence detection of Barrett's neoplasia.Endoscopy. 2016 Feb;48(2):A1-A13. doi: 10.1055/s-0034-1392803. Epub 2015 Oct 1. Endoscopy. 2016. PMID: 26426999 Free PMC article. Clinical Trial.
Cited by
-
Integrated Imaging Methodology Detects Claudin-1 Expression in Premalignant Nonpolypoid and Polypoid Colonic Epithelium in Mice.Clin Transl Gastroenterol. 2020 Jan;11(1):e00089. doi: 10.14309/ctg.0000000000000089. Clin Transl Gastroenterol. 2020. PMID: 31922993 Free PMC article.
-
Ultra-Compact Microsystems-Based Confocal Endomicroscope.IEEE Trans Med Imaging. 2020 Jul;39(7):2406-2414. doi: 10.1109/TMI.2020.2971476. Epub 2020 Feb 3. IEEE Trans Med Imaging. 2020. PMID: 32012007 Free PMC article.
-
Detection of Barrett's neoplasia with a near-infrared fluorescent heterodimeric peptide.Endoscopy. 2022 Dec;54(12):1198-1204. doi: 10.1055/a-1801-2406. Epub 2022 Mar 17. Endoscopy. 2022. PMID: 35299273 Free PMC article. Clinical Trial.
-
Cranberry Polyphenols in Esophageal Cancer Inhibition: New Insights.Nutrients. 2022 Feb 24;14(5):969. doi: 10.3390/nu14050969. Nutrients. 2022. PMID: 35267943 Free PMC article.
-
Dual-modal in vivo fluorescence and photoacoustic imaging using a heterodimeric peptide.Chem Commun (Camb). 2018 Nov 22;54(94):13196-13199. doi: 10.1039/c8cc06774k. Chem Commun (Camb). 2018. PMID: 30334022 Free PMC article.
References
-
- Torre LA; Siegel RL; Ward EM; Jemal A Global cancer incidence and mortality rates and trends—an update. Cancer Epidemiol. Biomarkers Prev 2016, 25, 16–27. - PubMed
-
- Spechler SJ; Souza RF Barrett’s esophagus. N. Engl. J. Med 2014, 371, 836–845. - PubMed
-
- Levine DS; Haggitt RC; Blount PL; Rabinovitch PS; Rusch VW; Reid BJ An endoscopic biopsy protocol can differentiate high-grade dysplasia from early adenocarcinoma in barrett’s esophagus. Gastroenterology 1993, 105, 40–50. - PubMed
Publication types
MeSH terms
Substances
Supplementary concepts
Grants and funding
LinkOut - more resources
Full Text Sources
Other Literature Sources
Research Materials
Miscellaneous
