. 2018 Jun 5;13(6):e0196878.
doi: 10.1371/journal.pone.0196878. eCollection 2018.

Bioinformatics core competencies for undergraduate life sciences education

Affiliations

Bioinformatics core competencies for undergraduate life sciences education

Melissa A Wilson Sayres et al. PLoS One. .

Abstract

Although bioinformatics is becoming increasingly central to research in the life sciences, bioinformatics skills and knowledge are not well integrated into undergraduate biology education. This curricular gap prevents biology students from harnessing the full potential of their education, limiting their career opportunities and slowing research innovation. To advance the integration of bioinformatics into life sciences education, a framework of core bioinformatics competencies is needed. To that end, we here report the results of a survey of biology faculty in the United States about teaching bioinformatics to undergraduate life scientists. Responses were received from 1,260 faculty representing institutions in all fifty states with a combined capacity to educate hundreds of thousands of students every year. Results indicate strong, widespread agreement that bioinformatics knowledge and skills are critical for undergraduate life scientists as well as considerable agreement about which skills are necessary. Perceptions of the importance of some skills varied with the respondent's degree of training, time since degree earned, and/or the Carnegie Classification of the respondent's institution. To assess which skills are currently being taught, we analyzed syllabi of courses with bioinformatics content submitted by survey respondents. Finally, we used the survey results, the analysis of the syllabi, and our collective research and teaching expertise to develop a set of bioinformatics core competencies for undergraduate biology students. These core competencies are intended to serve as a guide for institutions as they work to integrate bioinformatics into their life sciences curricula.


Conflict of interest statement

We declare that author TMS has an affiliation with a private company, Digital World Biology (DWB). As noted in the updated Funding Statement, DWB provided support for this work in the form of salary for TMS. This affiliation does not alter our adherence to PLOS ONE policies on sharing data and materials.

Figures

Fig 1
Fig 1. Geographic distribution of NIBLSE survey respondents.
The location (city/state) of each response to the survey was obtained using e-mail and/or IP addresses. The distribution of responses for the contiguous U.S. is shown (n = 1,081). A light circle represents one response at a particular location; a darker circle represents multiple responses at the same location (the darker the circle, the more responses). Note that the legend applies to the states themselves—e.g., there were more than seventy-five responses from California—and that there are no states with no responses. Responses (not shown) were also received from Alaska, Hawaii, Argentina, Australia, Canada, Denmark, France, Italy, Korea, New Zealand, Norway, Puerto Rico, the Republic of Poland, Switzerland, and the United Kingdom.
Fig 2
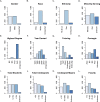
Fig 2. Demographics of survey respondents.
The number of responses (y-axes) for each of the demographic variables (x-axes) on the survey, as follows: (A) Gender. (B) Race (People of Color and White); four categories in Race—American Indian or Alaska Native, Asian, Black or African American, Native Hawaiian or other Pacific Islander—were combined into People of Color (POC) due to very small sample numbers for each category. (C) Ethnicity (Hispanic-Latino, non-Hispanic/Latino). (D) Minority Serving (whether or not the respondent’s home institution is classified as minority-serving). (E) Highest Degree (highest degree earned: Bachelor’s, Master’s, Professional Degree, PhD). (F) Year Earned (year that the highest degree was earned; responses were grouped in the following bins: Before 1980, 1980 to 1989, 1990 to 1999, 2000 to 2009, and After 2009). (G) Training (level of bioinformatics training: None, Self-taught, Short workshop, Undergraduate/PostBacc training, Graduate class, and Graduate degree); four categories in Training—Undergraduate course, Undergraduate certificate, Undergraduate degree, and Post-baccalaureate certificate—were grouped together into “Undergrad” (undergraduate/post-baccalaureate training) due to small sample numbers in these categories. (H) Carnegie (Carnegie classification of the respondent’s home institution: Associate’s, Baccalaureate, Master’s, Doctoral). (I) Total Students (total number of students at the respondent’s home institution). (J) Total Undergraduates (number of undergraduates at the respondent’s home institution). (K) Undergraduate Majors (number of undergraduate majors in the respondent’s home department). (L) Faculty (number of faculty in the respondent’s home department).
Fig 3
Fig 3. Summary of bioinformatics skills ratings.
The total number of responses (y-axes) by Likert-scale rating from 1 to 5 (x-axes)—1 being “Not at all important” to 5 being “Extremely important”—for each of the fifteen survey skills, S1 to S15, labeled in sequence from (A) to (O). As discussed in Results, these skills were divided into two broad categories: skills that just required familiarity (“knowing” skills: S1 to S4, S6, S8, S10), and those that required direct engagement (“practicing” skills: S5, S7, S9, S11 to S15).
Fig 4
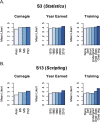
Fig 4. Mean Likert responses for S3 (Statistics) and S13 (Scripting).
Mean Likert responses are shown for (A) S3 (Statistics) and (B) S13 (Scripting) for three categories: Carnegie (Carnegie Classification of the respondent’s home institution: Associate’s, Baccalaureate, Master’s, Doctoral), Year Earned (year that the highest degree was earned; responses were grouped in the following bins: Before 1980, 1980 to 1989, 1990 to 1999, 2000 to 2009, and After 2009), and Training (level of bioinformatics training: None, Self-taught, Short workshop, Undergraduate/PostBacc training, Graduate class, and Graduate degree). Means and P values from pairwise KS tests are reported in [34].
Fig 5
Fig 5. Importance of the fifteen bioinformatics skills as rated by survey respondents compared to coverage of the skills in the syllabi.
Skills are shown with the proportion of survey responses rating the skill as either “Very Important” or “Extremely Important” (blue bars) and the proportion of submitted syllabi that exhibited evidence of the skill (grey bars). Skills requiring familiarity with a concept (“knowing” skills) are to the left of the vertical dashed line; skills requiring direct engagement (“practice” skills) are to the right. In their respective categories, skills are presented in order of decreasing proportion of survey responses rating the skill as Very or Extremely Important.
Fig 6
Fig 6. Histogram of number of skills covered per syllabus.
The number of syllabi that addressed the specified number of survey skills (S1 to S15). For example, ten syllabi addressed only one of the fifteen skills. On average, a syllabus covered 5.5 skills, with a median of 6 skills addressed. In aggregate, the submitted syllabi covered all fifteen skills, but no single syllabus covered more than thirteen out of the fifteen skills.

References

    1. National Research Council. BIO2010: transforming undergraduate education for future research biologists Washington: National Academies Press; 2003. Available from: https://doi.org/10.17226/10497 - DOI - PubMed
    1. Bialek W, Botstein D. Introductory science and mathematics education for 21st-century biologists. Science. 2004;303:788–90. doi: 10.1126/science.1095480 - DOI - PubMed
    1. Lopatto D, Alvarez C, Barnard D, Chandrasekaran C, Chung H-M, Du C, et al. Undergraduate research: Genomics Education Partnership. Science. 2008;322:684–85. doi: 10.1126/science.1165351 - DOI - PMC - PubMed
    1. Campbell AM, Ledbetter MLS, Hoopes LLM, Eckdahl TT, Heyer LJ, Rosenwald A, et al. Genome Consortium for Active Teaching: meeting the goals of BIO2010. CBE Life Sci Educ. 2007;6:109–18. doi: 10.1187/cbe.06-10-0196 - DOI - PMC - PubMed
    1. Drew JC, Triplett EW. Whole genome sequencing in the undergraduate classroom: outcomes and lessons from a pilot course. J Microbiol Biol Educ. 2008;9:3–11. - PMC - PubMed

Publication types

LinkOut - more resources