. 2018 Apr;27(4):589-606.
doi: 10.1177/0963689718774030. Epub 2018 Jun 5.

A Role for Nrf2 Expression in Defining the Aging of Hippocampal Neural Stem Cells

Affiliations

A Role for Nrf2 Expression in Defining the Aging of Hippocampal Neural Stem Cells

S Ray et al. Cell Transplant. 2018 Apr.

Abstract

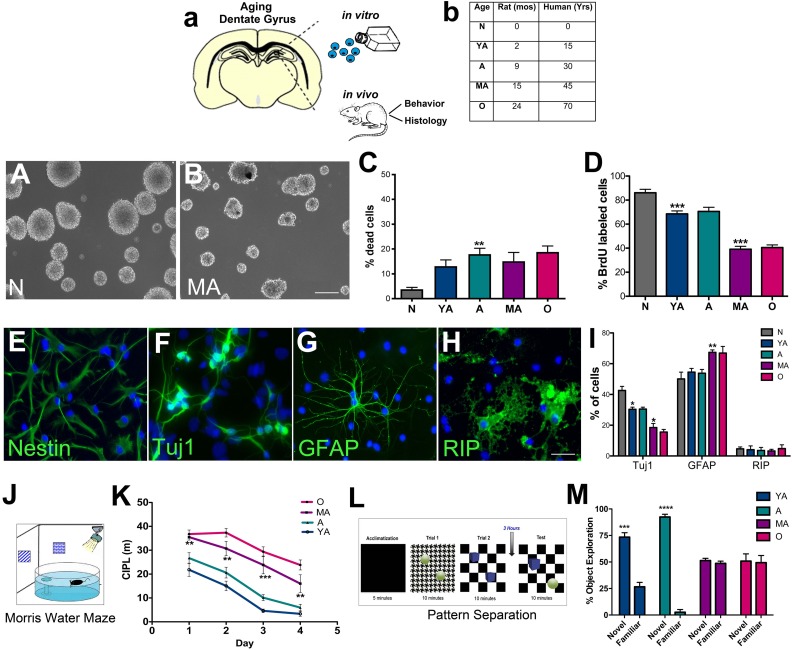
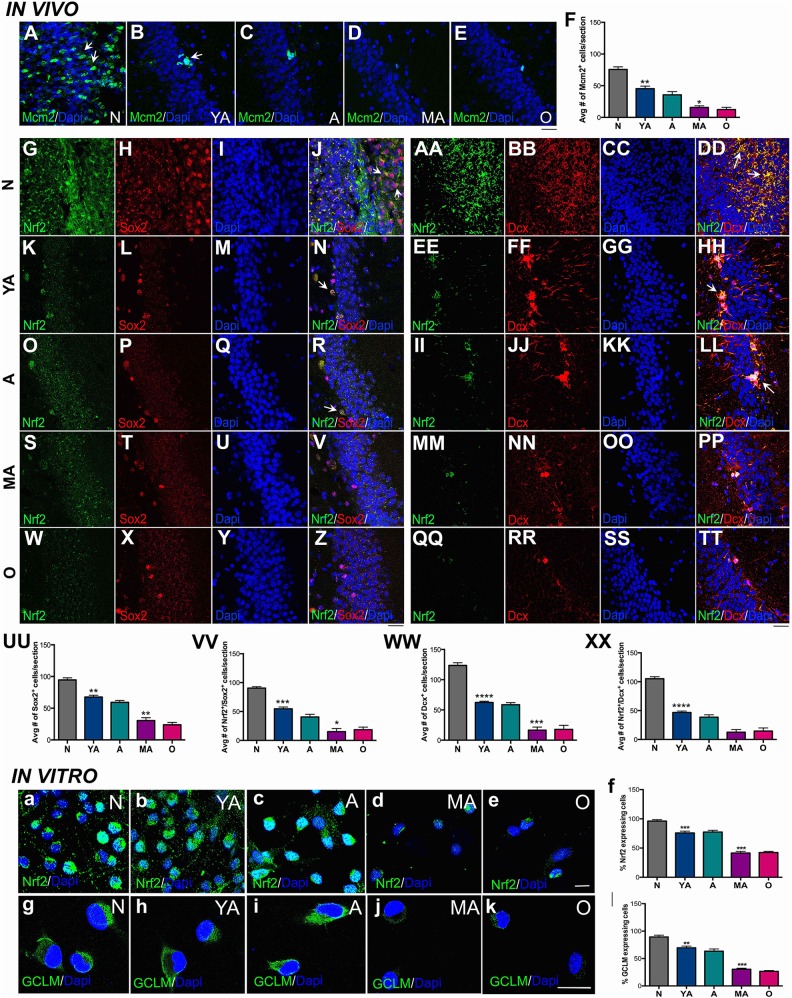
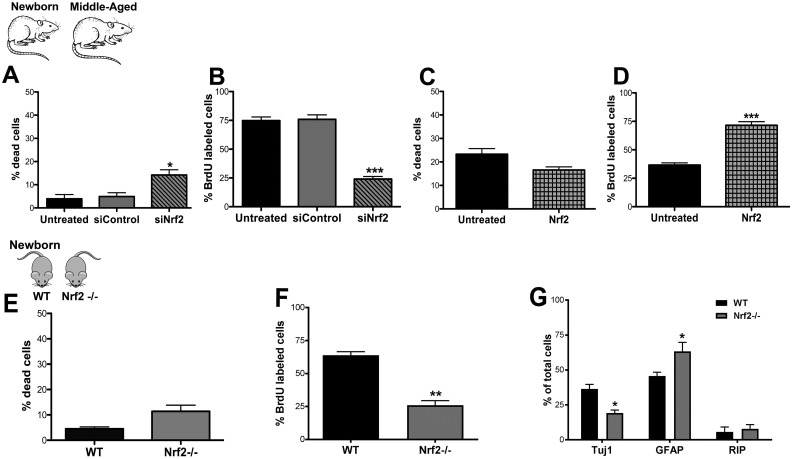
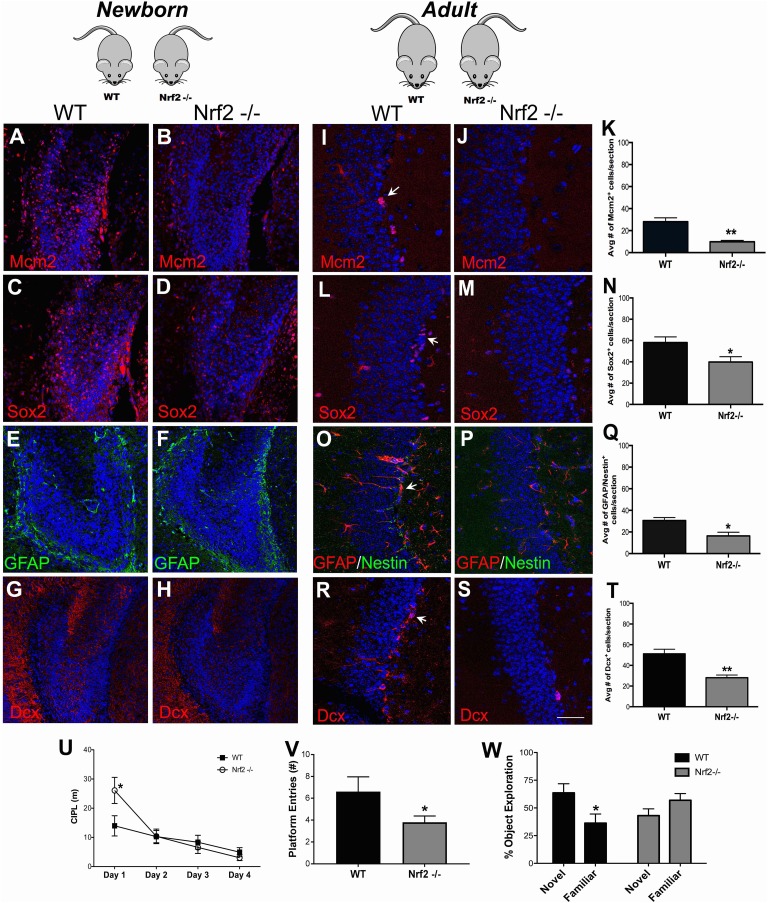
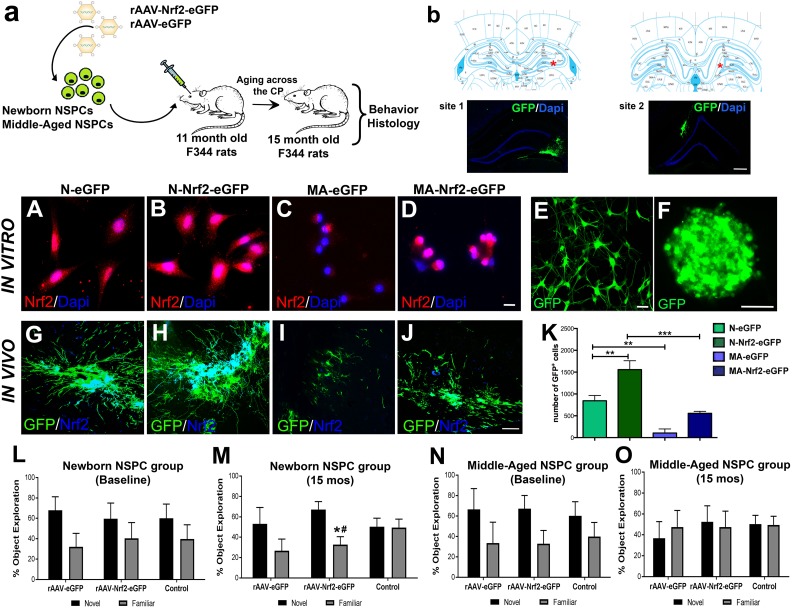
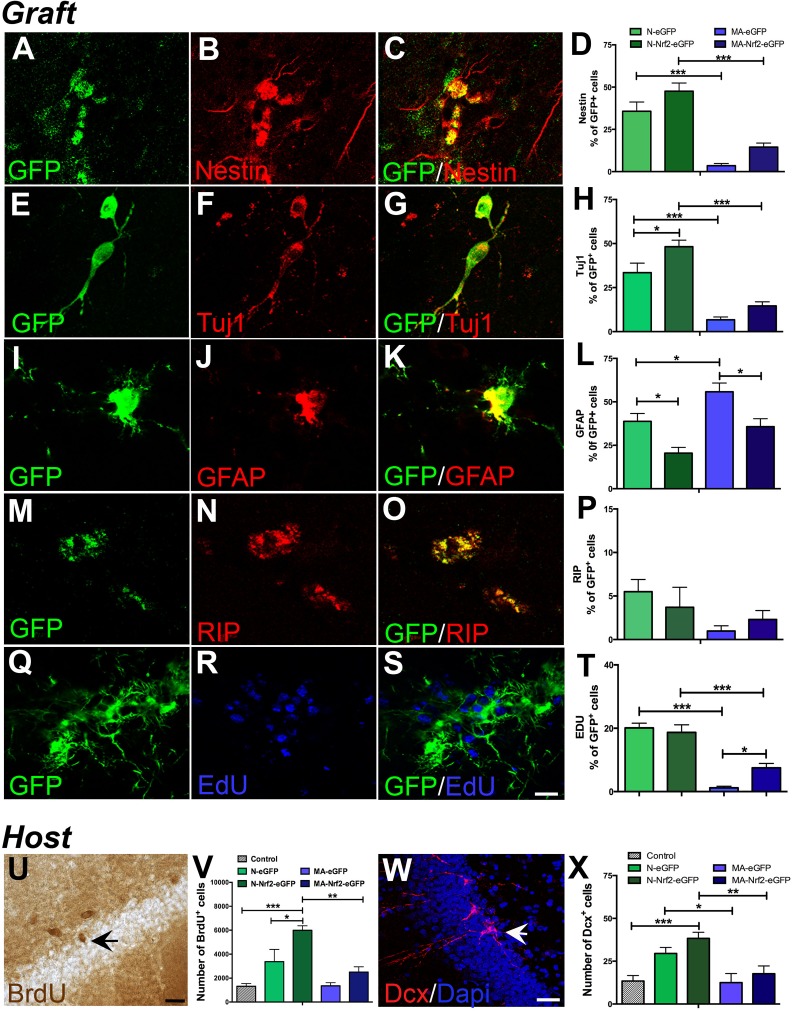
Redox mechanisms are emerging as essential to stem cell function given their capacity to influence a number of important signaling pathways governing stem cell survival and regenerative activity. In this context, our recent work identified the reduced expression of nuclear factor (erythroid-derived 2)-like 2, or Nrf2, in mediating the decline in subventricular zone neural stem progenitor cell (NSPC) regeneration during aging. Since Nrf2 is a major transcription factor at the heart of cellular redox regulation and homeostasis, the current study investigates the role that it may play in the aging of NSPCs that reside within the other major mammalian germinal niche located in the subgranular zone (SGZ) of the dentate gyrus (DG) of the hippocampus. Using rats from multiple aging stages ranging from newborn to old age, and aging Nrf2 knockout mice, we first determined that, in contrast with subventricular zone (SVZ) NSPCs, Nrf2 expression does not significantly affect overall DG NSPC viability with age. However, DG NSPCs resembled SVZ stem cells, in that Nrf2 expression controlled their proliferation and the balance of neuronal versus glial differentiation particularly in relation to a specific critical period during middle age. Also, importantly, this Nrf2-based control of NSPC regeneration was found to impact functional neurogenesis-related hippocampal behaviors, particularly in the Morris water maze and in pattern separation tasks. Furthermore, the enrichment of the hippocampal environment via the transplantation of Nrf2-overexpressing NSPCs was able to mitigate the age-related decline in DG stem cell regeneration during the critical middle-age period, and significantly improved pattern separation abilities. In summary, these results emphasize the importance of Nrf2 in DG NSPC regeneration, and support Nrf2 upregulation as a potential approach to advantageously modulate DG NSPC activity with age.

Keywords: Nrf2; aging; dentate gyrus; neural stem cells; redox; transplantation.


Conflict of interest statement

Declaration of Conflicting Interests: The authors declared no potential conflicts of interest with respect to the research, authorship, and/or publication of this article.

Figures

Fig. 1.
Fig. 1.
In vitro characterization and related behavioral analysis of hippocampal NSPC survival and regenerative function across age. The schematic in (A) depicts the experimental design. The main age-groups of rats (with corresponding human years) used in the study are shown in (B). NSPCs were cultured from these rats for in vitro studies, and the animals were also behaviorally and histologically assessed. A–B are representative phase-contrast images of newborn and middle-aged NSPCs grown as neurospheres in culture. In vitro analysis of viability and proliferation via live-dead and BrdU assays are shown in C and D (C; p < 0.01, YA versus A: D; p < 0.001, YA versus A and A versus MA; One-way ANOVA with Tukey’s post-hoc test). E–H show examples of undifferentiated NSPCs (E, nestin+) and NSPCs which differentiated into Tuj1+ neurons (F), GFAP+ astrocytes (G) and RIP+ oligodendrocytes (H). The graph in I shows quantification of this capacity across the five age-groups in (Tuj1+- p < 0.05, N versus YA; p < 0.05, A versus MA, one-way ANOVA with Tukey’s post-hoc test; GFAP+- p < 0.01, A versus MA, one-way ANOVA with Tukey’s post-hoc test). The diagram in J shows the Morris water maze behavior analysis set-up and K depicts the results of the task conducted on the different age-groups of rats (K; A versus MA, Two-way RM-ANOVA with Tukey’s post-hoc test). Similarly, the experimental set-up of the pattern separation task is shown in L, and results are in M (YA p < 0.001 and A p < 0.0001, unpaired t tests). *p < 0.05, **p < 0.01, ***p < 0.001. Scale Bars: A: 50 µm, B: 200 µm, E–H: 20 µm. A: adult; ANOVA: analysis of variance; BrdU: bromodeoxyuridine; GFAP: glial fibrillary acidic protein; MA: middle-aged; NSPC: neural stem progenitor cell; YA: young adult.
Fig. 2.
Fig. 2.
Correlation of decline in DG NSPC regeneration to Nrf2 expression. Immunohistochemical analysis by age group (N, YA, A, MA and O) illustrating MCM2 staining (for proliferation) in A–E and its quantification is in F (p < 0.01, N versus YA and p < 0.05, A versus MA; one-way ANOVA with Tukey’s post-hoc test). Qualitative assessment of hippocampal Sox2+ NSPCs and their expression of Nrf2 across the five age-groups is in G–Z, with quantification in UU (p < 0.01, N versus YA and p < 0.01, A versus MA; one-way ANOVA with Tukey’s post-hoc test), and VV (p < 0.001, N versus YA and p < 0.05, A versus MA; one-way ANOVA with Tukey’s post-hoc test) are shown. Similarly, qualitative and quantitative analysis of Dcx+ cells is in AA–TT, WW (p < 0.0001, N versus YA and p < 0.001, A versus MA; one-way ANOVA with Tukey’s post-hoc test) and XX (p < 0.0001, N versus YA and p < 0.01, A versus MA; one-way ANOVA with Tukey’s post-hoc test). Expression of Nrf2 and GCLM in cultured hippocampal NSPCs across the five age-groups is shown in a–e and g–k, with quantification in f (p < 0.001, N versus YA and p < 0.001, A versus MA; one-way ANOVA with Tukey’s post-hoc test) and l (p < 0.01, N versus YA and p < 0.001, A versus MA; one-way ANOVA with Tukey’s post-hoc test). *p < 0.05, **p < 0.01, ***p < 0.001. Scale bars: A–E; G–Z, AA–TT: 25 µm, a–e: 15 µm. A: adult; ANOVA: analysis of variance; DG: dentate gyrus; N: newborn; GCLM: glutamate–cysteine ligase modifier subunit; MA: middle-aged; NSPC: neural stem progenitor cell; O: old; YA: young adult.
Fig. 3.
Fig. 3.
Effects of altered Nrf2 expression on DG NSPC regeneration in vitro. Graphs A and B show results from live-dead (viability) and BrdU (proliferation) assays performed on untreated, control siRNA, and Nrf2 siRNA-treated (siNrf2) newborn rat hippocampal NSPCs (p < 0.05, p < 0.001, U/siC versus siNrf2, unpaired t tests). Panels C and D show the viability and proliferation of untreated middle-aged cells compared with those transfected with Nrf2 (p < 0.001, U versus Nrf2). The in vitro survival and proliferative function of DG NSPCs isolated from Nrf2-/- mice compared with WT mice is depicted in E and F (p < 0.01, unpaired t tests). The capacity of newborn Nrf2 WT and Nrf2-/- NSPCs to differentiate into Tuj1+ neurons (p < 0.05, unpaired t test), GFAP+ astrocytes (p < 0.05, unpaired t test), and RIP+ oligodendrocytes is in (G). *p < 0.05, **p < 0.01, ***p < 0.001. BrdU: bromodeoxyuridine; DG: dentate gyrus; GFAP: glial fibrillary acidic protein; NSPC: neural stem progenitor cell.
Fig. 4.
Fig. 4.
In vivo assessment of DG NSPCs from Nrf2 knockout mice. In vivo immunohistochemical analysis of the DG NSPCs in newborn Nrf2 WT and Nrf2-/- mice using antibodies targeting MCM2 (proliferation; A–B), Sox2 (proliferating neural progenitors; C–D), GFAP (astrocytes; E–F) and Dcx (neuroblasts; G–H) was performed. NSPCs from adult Nrf2 WT and knockout animals were also assessed: MCM2 (I–K), Sox2 (L–N), GFAP/nestin (O–Q) and Dcx (R–T). Behavioral analysis of young adult Nrf2 WT and knockout mice through the Morris water maze task is shown in U, and the number of platform entries in the probe trial is in V (p < 0.05, unpaired t tests). Behavioral results from the pattern separation task is in W (p < 0.05, unpaired t tests). *p < 0.05, **p < 0.01. Scale bars: A–H: 60 µm, I–S: 30 µm. DG: dentate gyrus; GFAP: glial fibrillary acidic protein; NSPC: neural stem progenitor cell.
Fig. 5.
Fig. 5.
Characterization of NSPC transplants overexpressing Nrf2 and their behavioral effects across the critical period. (A) Schematic of the experimental design illustrating that newborn and middle-aged NSPCs were transfected with an eGFP tagged AAV2/1 virus with or without Nrf2. These cells were transplanted into the DG of 11-month-old rats and the animals aged through the CP of NSPC decline. Behavioral and histological analysis was performed at age 15 months of age. Stereotaxic transplantation sites are noted in B with corresponding fluorescence confirmation of GFP+ graft locations. Nrf2 expression in newborn (N) and middle-aged (MA) NPSCs with or without viral Nrf2 transduction is in A–D. Representation of AAV2/1 transduced NSPC cultures, as single-cell and neurospheres, before grafting is in E and F. In vivo Nrf2 expression of GFP+ transplants are in G–J (newborn grafts (G–H) and middle-aged grafts (I–J)). Quantification of grafted cells in the different experimental groups is in K (p < 0.01 N-eGFP versus N-Nrf2-eGFP; p < 0.01, N-eGFP versus MA-eGFP; p < 0.001, N-Nrf2-eGFP versus MA-Nrf2-eGFP; one-way ANOVA with post-hoc Tukey’s test). Results from the pattern separation task, conducted on naïve 11-month-old animals before transplantation (baseline) are in L, N, and after the CP at 15 mo are in M, O (*p < 0.05, novel versus familiar in animals implanted with newborn grafts overexpressing Nrf2, #p < 0.05 compared with control). *p < 0.05, **p < 0.01, #p < 0.05. Scale bars: B: 200 µm, A, C–D: 20 µm, E: 25 µm, F: 100 µm, G–J: 50 µm. ANOVA: analysis of variance; CP: critical period; DAPI: 4’,6’-diamidino-2-phenylindole, dihydrochloride; DG: dentate gyrus; GFP: green fluorescent protein; NSPC: neural stem progenitor cell; eGFP: enhanced green fluorescent protein.
Fig. 6.
Fig. 6.
Quantification of grafted NSPC phenotype and the induction of host DG plasticity. Examples of grafted (GFP+) undifferentiated NSPCs (nestin+, A–C) and their differentiation into Tuj1+ neurons (E–G), GFAP+ astrocytes (I–L), and RIP+ oligodendrocytes (M–O). The quantifications of nestin, Tuj1, GFAP and RIP expressing cells within the newborn and middle-aged grafts are in D, H, L, P. Graft proliferation, assessed via the quantification of EdU incorporation, is in Q-T. On the other hand, host DG NSPC proliferation was examined via BrdU labeling (example in U). Stereological quantification of host BrdU+ cells in various NSPC transplanted groups is shown in the graph in V. Dcx+ neuroblasts (example in W) were enumerated in the host DG (in X). *p < 0.05, **p < 0.01, ***p < 0.001, one-way ANOVA with post-hoc Tukey’s tests. Scale bars: A: 20 µm; U, W: 30 µm. ANOVA: analysis of variance; BrdU: bromodeoxyuridine; Dcx: doublecortin; DG: dentate gyrus; EdU: 5-ethynyl-2’-deoxyuridine; GFAP: glial fibrillary acidic protein; GFP: green fluorescent protein; NSPC: neural stem progenitor cell.

References

    1. Alvarez-Buylla A, Lim DA. For the long run: maintaining germinal niches in the adult brain. Neuron. 2004;41(5):683–686. - PubMed
    1. Doetsch F. A niche for adult neural stem cells. Curr Opin Genet Dev. 2003;13(5):543–550. - PubMed
    1. Conover JC, Shook BA. Aging of the subventricular zone neural stem cell niche. Aging Dis. 2011;2(1):49–63. - PMC - PubMed
    1. Encinas JM, Michurina TV, Peunova N, Park JH, Tordo J, Peterson DA, Fishell G, Koulakov A, Enikolopov G. Division-coupled astrocytic differentiation and age-related depletion of neural stem cells in the adult hippocampus. Cell Stem Cell. 2011;8(5):566–579. - PMC - PubMed
    1. Liu L, Rando TA. Manifestations and mechanisms of stem cell aging. J Cell Biol. 2011;193(2):257–266. - PMC - PubMed

Publication types

Substances

LinkOut - more resources