

A Cyclin E Centered Genetic Network Contributes to Alcohol-Induced Variation in Drosophila Development
- PMID: 29871898
- PMCID: PMC6071605
- DOI: 10.1534/g3.118.200260
A Cyclin E Centered Genetic Network Contributes to Alcohol-Induced Variation in Drosophila Development
Abstract
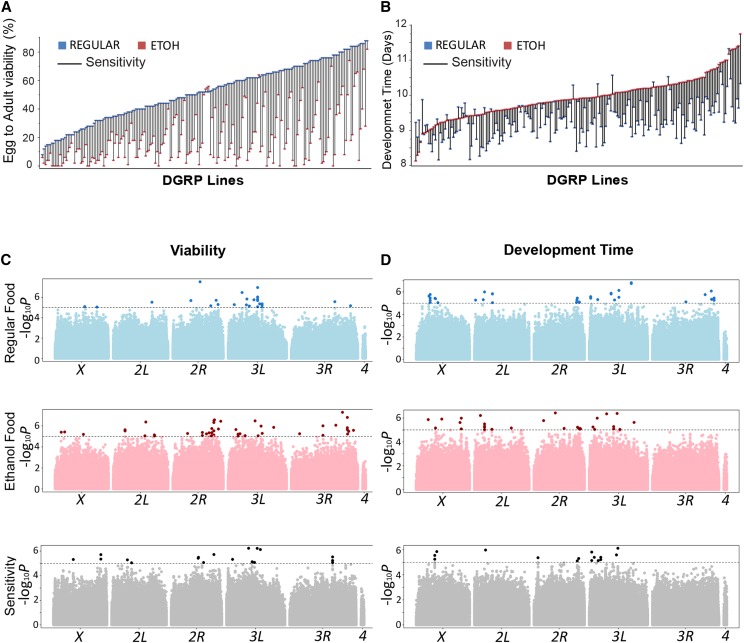
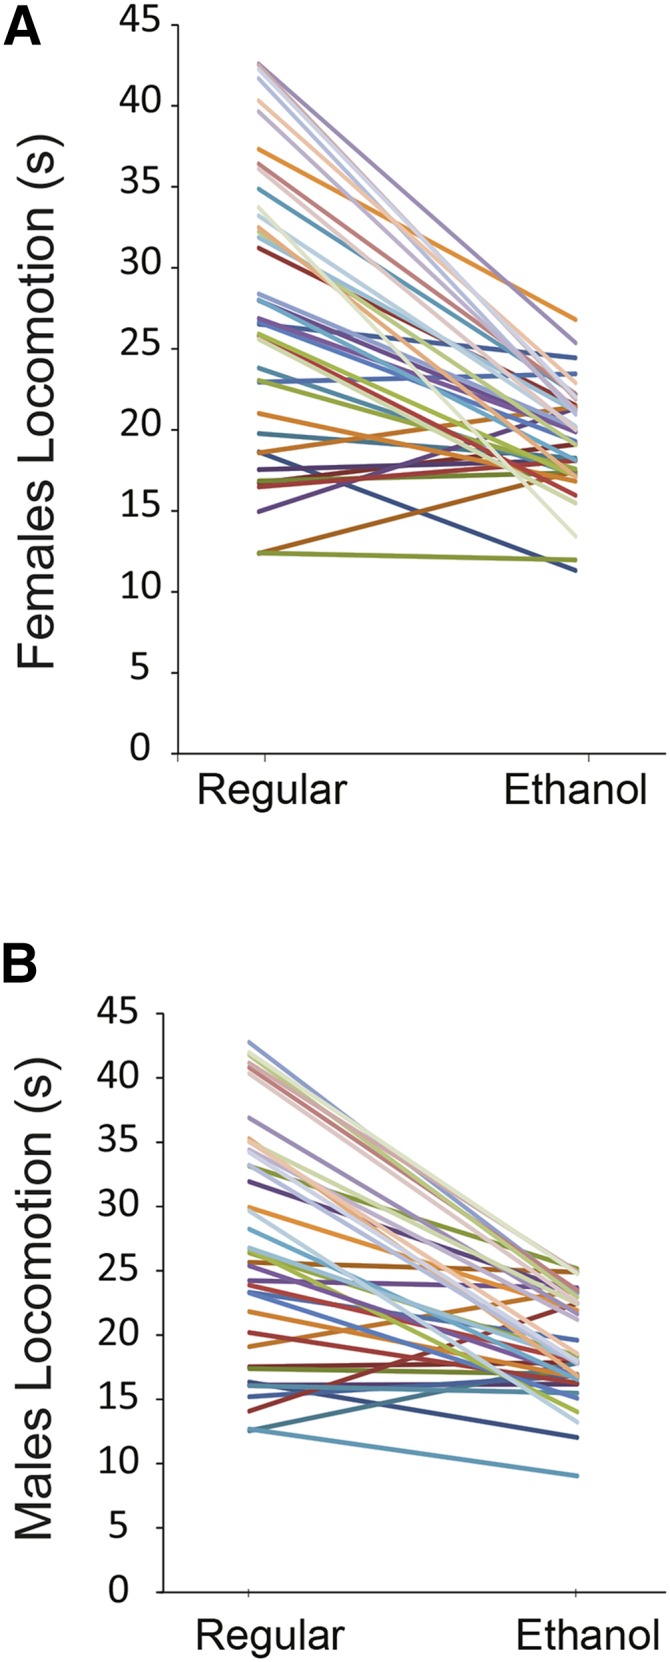
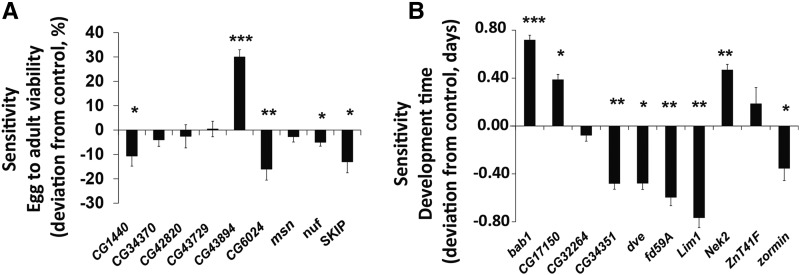
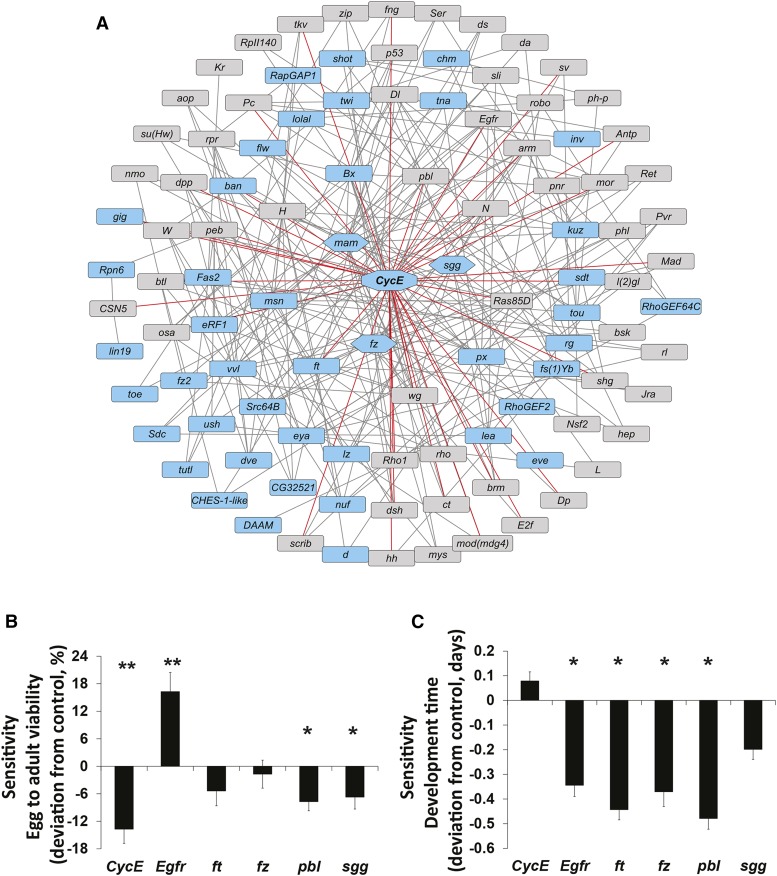
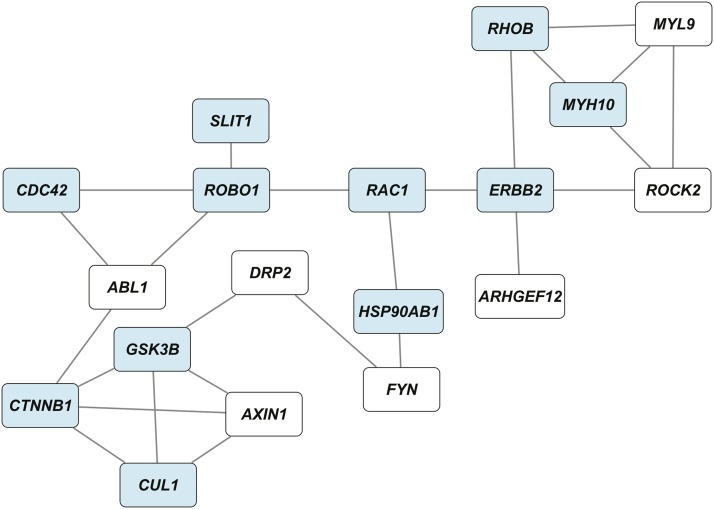
Prenatal exposure to ethanol causes a wide range of adverse physiological, behavioral and cognitive consequences. However, identifying allelic variants and genetic networks associated with variation in susceptibility to prenatal alcohol exposure is challenging in human populations, since time and frequency of exposure and effective dose cannot be determined quantitatively and phenotypic manifestations are diverse. Here, we harnessed the power of natural variation in the Drosophila melanogaster Genetic Reference Panel (DGRP) to identify genes and genetic networks associated with variation in sensitivity to developmental alcohol exposure. We measured development time from egg to adult and viability of 201 DGRP lines reared on regular or ethanol- supplemented medium and identified polymorphisms associated with variation in susceptibility to developmental ethanol exposure. We also documented genotype-dependent variation in sensorimotor behavior after developmental exposure to ethanol using the startle response assay in a subset of 39 DGRP lines. Genes associated with development, including development of the nervous system, featured prominently among genes that harbored variants associated with differential sensitivity to developmental ethanol exposure. Many of them have human orthologs and mutational analyses and RNAi targeting functionally validated a high percentage of candidate genes. Analysis of genetic interaction networks identified Cyclin E (CycE) as a central, highly interconnected hub gene. Cyclin E encodes a protein kinase associated with cell cycle regulation and is prominently expressed in ovaries. Thus, exposure to ethanol during development of Drosophila melanogaster might serve as a genetic model for translational studies on fetal alcohol spectrum disorder.
Keywords: Drosophila Genetic Reference Panel; ethanol sensitivity; genetic networks; genome-wide association; mutational analysis.
Copyright © 2018 Morozova et al.
Figures

Similar articles
-
Modulation of the Drosophila transcriptome by developmental exposure to alcohol.BMC Genomics. 2022 May 6;23(1):347. doi: 10.1186/s12864-022-08559-9. BMC Genomics. 2022. PMID: 35524193 Free PMC article.
-
Genetic architecture of natural variation in visual senescence in Drosophila.Proc Natl Acad Sci U S A. 2016 Oct 25;113(43):E6620-E6629. doi: 10.1073/pnas.1613833113. Epub 2016 Oct 10. Proc Natl Acad Sci U S A. 2016. PMID: 27791033 Free PMC article.
-
Genetics of alcohol consumption in Drosophila melanogaster.Genes Brain Behav. 2017 Sep;16(7):675-685. doi: 10.1111/gbb.12399. Epub 2017 Jul 21. Genes Brain Behav. 2017. PMID: 28627812 Free PMC article.
-
Alternative splicing in Drosophila neuronal development.J Neurogenet. 2014 Sep-Dec;28(3-4):199-215. doi: 10.3109/01677063.2014.936437. Epub 2014 Jul 21. J Neurogenet. 2014. PMID: 24957133 Review.
-
Effects of ethanol exposure on nervous system development in zebrafish.Int Rev Cell Mol Biol. 2012;299:255-315. doi: 10.1016/B978-0-12-394310-1.00007-2. Int Rev Cell Mol Biol. 2012. PMID: 22959306 Review.
Cited by
-
High-Throughput Method for Measuring Alcohol Sedation Time of Individual Drosophila melanogaster.J Vis Exp. 2020 Apr 20;(158):10.3791/61108. doi: 10.3791/61108. J Vis Exp. 2020. PMID: 32364549 Free PMC article.
-
Modulation of the Drosophila transcriptome by developmental exposure to alcohol.BMC Genomics. 2022 May 6;23(1):347. doi: 10.1186/s12864-022-08559-9. BMC Genomics. 2022. PMID: 35524193 Free PMC article.
-
Genetics of cocaine and methamphetamine consumption and preference in Drosophila melanogaster.PLoS Genet. 2019 May 20;15(5):e1007834. doi: 10.1371/journal.pgen.1007834. eCollection 2019 May. PLoS Genet. 2019. PMID: 31107875 Free PMC article.
-
Epistasis for head morphology in Drosophila melanogaster.G3 (Bethesda). 2021 Sep 27;11(10):jkab285. doi: 10.1093/g3journal/jkab285. G3 (Bethesda). 2021. PMID: 34568933 Free PMC article.
-
Developmental Alcohol Exposure in Drosophila: Effects on Adult Phenotypes and Gene Expression in the Brain.Front Psychiatry. 2021 Jul 22;12:699033. doi: 10.3389/fpsyt.2021.699033. eCollection 2021. Front Psychiatry. 2021. PMID: 34366927 Free PMC article.
References
-
- Antonov A. V., 2011. BioProfiling.de: analytical web portal for high-throughput cell biology. Nucleic Acids Res. 39: W323–W327. 10.1093/nar/gkr372 - DOI - PMC - PubMed
Publication types
MeSH terms
Substances
Grants and funding
LinkOut - more resources
Full Text Sources
Other Literature Sources
Molecular Biology Databases