. 2018 Jun 1;74(Pt 6):531-544.
doi: 10.1107/S2059798318006551. Epub 2018 May 30.

Real-space refinement in PHENIX for cryo-EM and crystallography

Affiliations

Real-space refinement in PHENIX for cryo-EM and crystallography

Pavel V Afonine et al. Acta Crystallogr D Struct Biol. .

Abstract

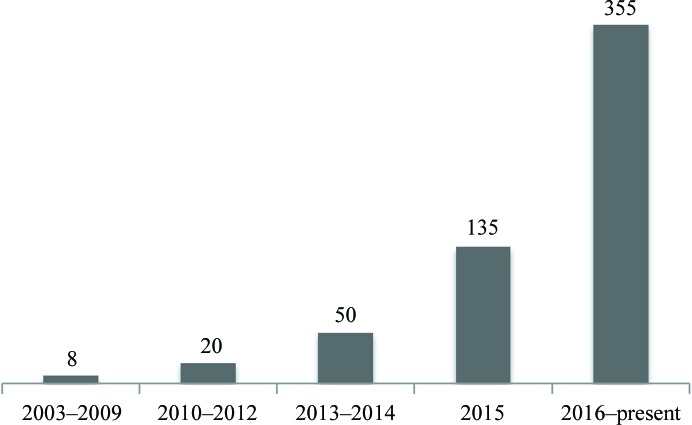
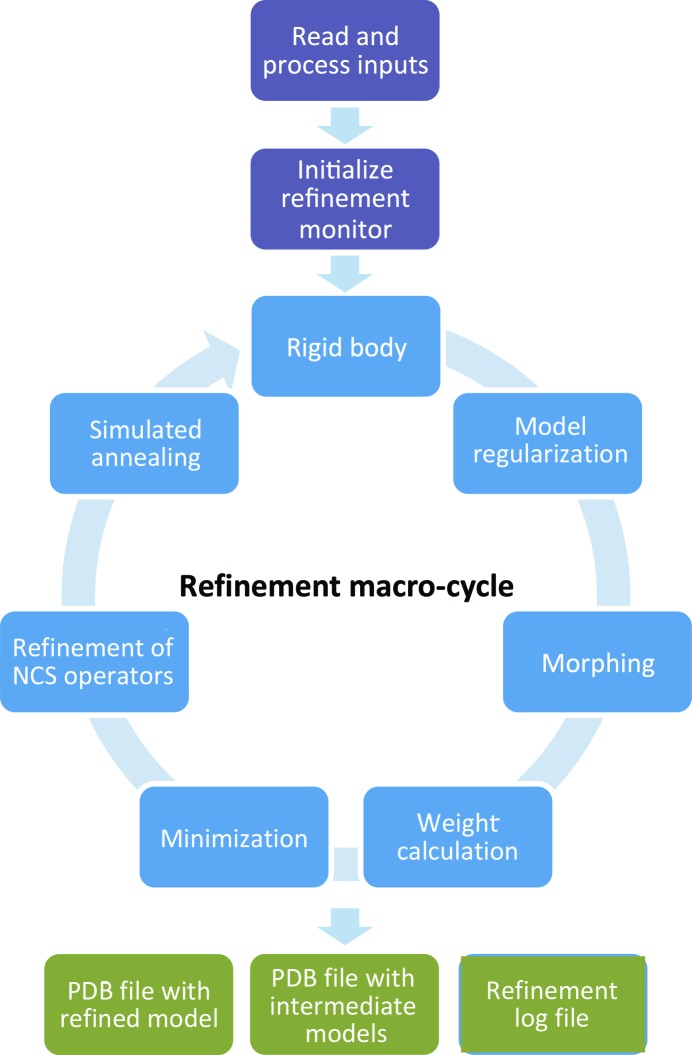
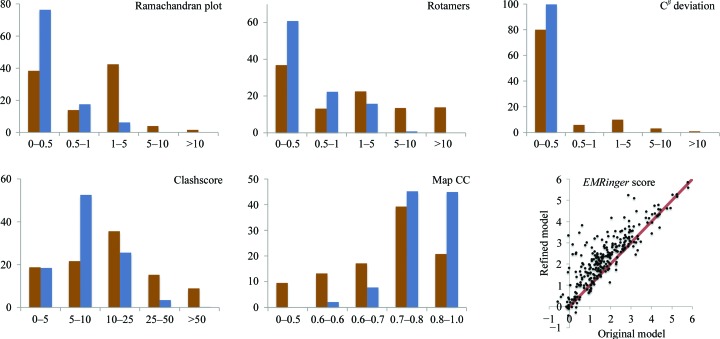
This article describes the implementation of real-space refinement in the phenix.real_space_refine program from the PHENIX suite. The use of a simplified refinement target function enables very fast calculation, which in turn makes it possible to identify optimal data-restraint weights as part of routine refinements with little runtime cost. Refinement of atomic models against low-resolution data benefits from the inclusion of as much additional information as is available. In addition to standard restraints on covalent geometry, phenix.real_space_refine makes use of extra information such as secondary-structure and rotamer-specific restraints, as well as restraints or constraints on internal molecular symmetry. The re-refinement of 385 cryo-EM-derived models available in the Protein Data Bank at resolutions of 6 Å or better shows significant improvement of the models and of the fit of these models to the target maps.

Keywords: PHENIX; atomic-centered targets; cryo-EM; crystallography; map interpolation; real-space refinement.


Figures

Figure 1
Figure 1
Number of cryo-EM-derived models in the PDB at resolutions of 6 Å or better.
Figure 2
Figure 2
Flowchart for phenix.real_space_refine.
Figure 3
Figure 3
Refinement of the exact model against 18 maps computed as described in §3.1.1. Each circle shows the root-mean-square deviation between the refined model and the reference model. Blue, green and orange full circles correspond to maps with overall B factors of 0, 100 and 200 Å2, respectively. Open circles correspond to the map with an overall B factor of 100 Å2 computed on the finer grid with a step of 0.2 Å. See §3.1.2 for details.
Figure 4
Figure 4
Refinement of perturbed models against maps computed as described in §3.1.1. The horizontal axis shows the r.m.s.d. between the reference model and perturbed models: 0.5, 1.0, 1.5 and 2.0 Å. The vertical axis shows the r.m.s.d. between the reference model and the refined models. Blue, green and orange full circles correspond to maps with overall B factors of 0, 100 and 200 Å2, respectively. See §3.1.3 for details.
Figure 5
Figure 5
Distribution of cryo-EM map values (scaled in r.m.s.) for selected groups of atoms, considering maps at 3 Å or better (a) and 3–4 Å (b) resolution. See §3.2.1 for details.
Figure 6
Figure 6
Model statistics before (brown) and after (blue) refinement using phenix.real_space_refine, showing Ramachandran plot and residue side-chain rotamer outliers, Cβ deviations, MolProbity clashscore and model–map correlation coefficient (CCmask). The scatter plot shows the EMRinger score for the original and refined models (resolution better than 4.5 Å).
Figure 7
Figure 7
Left, correlation coefficient CCmask calculated using the original second half-maps and maps calculated from models refined against the first half-maps: original (x axis) versus sharpened (y axis). Right, MolProbity scores for models using original first half-maps versus sharpened first half-maps.
Figure 8
Figure 8
Backbone of the 3j5p model before (a) and after (b) refinement shown in black. The model before refinement contains a substantial number of steric clashes (indicated by red dots) and many side-chain rotamer outliers (blue side chains). Most clashes and rotamer outliers are resolved by phenix.real_space_refine. The images were created using the KiNG program (Chen et al., 2009 ▸) from within PHENIX.
Figure 9
Figure 9
(a) Ensemble of perturbed 3j5p models; the r.m.s. deviation of each model from the initial model is 3 Å, showing chain A only. (b) Ensemble of refined models in the experimental map. The largest variation is observed in regions that lack density. The images were created using the ChimeraX program (Goddard et al., 2018 ▸).

Similar articles

Cited by

References

    1. Adams, P. D. et al. (2010). Acta Cryst. D66, 213–221. - PubMed
    1. Afonine, P. V., Grosse-Kunstleve, R. W., Echols, N., Headd, J. J., Moriarty, N. W., Mustyakimov, M., Terwilliger, T. C., Urzhumtsev, A., Zwart, P. H. & Adams, P. D. (2012). Acta Cryst. D68, 352–367. - PMC - PubMed
    1. Afonine, P. V., Grosse-Kunstleve, R. W., Urzhumtsev, A. & Adams, P. D. (2009). J. Appl. Cryst. 42, 607–615. - PMC - PubMed
    1. Afonine, P. V., Headd, J. J., Terwilliger, T. C. & Adams, P. D. (2013). Comput. Crystallogr. Newsl. 4, 43–44. https://www.phenix-online.org/newsletter/CCN_2013_07.pdf.
    1. Afonine, P. V., Klaholz, B. K., Moriarty, N. W., Poon, B. K., Sobolev, O. V., Terwilliger, T. C., Adams, P. D. & Urzhumtsev, A. (2018). bioRxiv. https://doi.org/10.1101/249607.

Publication types

Substances