. 2018 Jun 1;74(Pt 6):545-559.
doi: 10.1107/S2059798318004655. Epub 2018 May 18.

Automated map sharpening by maximization of detail and connectivity

Affiliations

Automated map sharpening by maximization of detail and connectivity

Thomas C Terwilliger et al. Acta Crystallogr D Struct Biol. .

Abstract

An algorithm for automatic map sharpening is presented that is based on optimization of the detail and connectivity of the sharpened map. The detail in the map is reflected in the surface area of an iso-contour surface that contains a fixed fraction of the volume of the map, where a map with high level of detail has a high surface area. The connectivity of the sharpened map is reflected in the number of connected regions defined by the same iso-contour surfaces, where a map with high connectivity has a small number of connected regions. By combining these two measures in a metric termed the `adjusted surface area', map quality can be evaluated in an automated fashion. This metric was used to choose optimal map-sharpening parameters without reference to a model or other interpretations of the map. Map sharpening by optimization of the adjusted surface area can be carried out for a map as a whole or it can be carried out locally, yielding a locally sharpened map. To evaluate the performance of various approaches, a simple metric based on map-model correlation that can reproduce visual choices of optimally sharpened maps was used. The map-model correlation is calculated using a model with B factors (atomic displacement factors; ADPs) set to zero. This model-based metric was used to evaluate map sharpening and to evaluate map-sharpening approaches, and it was found that optimization of the adjusted surface area can be an effective tool for map sharpening.

Keywords: X-ray crystallography; cryo-electron microscopy; map interpretation; map sharpening.


Figures

Figure 1
Figure 1
Flow chart for the auto-sharpening procedure.
Figure 2
Figure 2
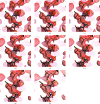
Sharpened/blurred versions of the cryo-EM map of the anthrax protective antigen pore (Jiang et al., 2015 ▸). (a) Overall B iso = −100 Å2. (b) Overall B iso = 60 Å2. (c) Overall B iso = 150 Å2. (d) Original map (EMD-6224). (e) Auto-sharpened map, overall B iso = 20 Å2. All contours are drawn at 3σ. Maps were drawn with Coot (Emsley et al., 2010 ▸) and RASTER3D (Merritt & Bacon, 1997 ▸).
Figure 3
Figure 3
Surface area, number of regions and adjusted surface area of sharpened/blurred versions of the cryo-EM map of the anthrax protective antigen pore (Jiang et al., 2015 ▸). See the text for details.
Figure 4
Figure 4
Resolution-dependence of the mean amplitude of Fourier coefficients for the cryo-EM map of the anthrax protective antigen pore and for the auto-sharpened map.
Figure 5
Figure 5
Cryo-EM map of the innexin-6 gap junction channel (EMD-9571 and PDB entry 5h1r; Oshima et al., 2016 ▸) after the application of sharpening. Contours are chosen to yield equal volumes inside contours in each map (Urzhumtsev et al., 2014 ▸). The final values of overall B iso and the contour levels used are as follows: (a) 0 Å2, 1.20σ; (b) 20 Å2, 1.20σ; (c) 40 Å2, 1.20σ; (d) 60 Å2, 1.22σ; (e) 80 Å2, 1.23σ; (f) 100 Å2, 1.24σ; (g) 120 Å2, 1.26σ (h) deposited map. Maps were drawn with Coot (Emsley et al., 2010 ▸) and RASTER3D (Merritt & Bacon, 1997 ▸).
Figure 6
Figure 6
Cryo-EM map of the TRPV1 channel (EMD-5778 and PDB entry 3j5p; Liao et al., 2013 ▸) in the vicinity of residues 449–455 after the application of sharpening. Contours are chosen to yield equal volumes inside contours in each map (Urzhumtsev et al., 2014 ▸). The final values of overall B iso and the contour levels used are as follows: (a) 0 Å2, 1.19σ; (b) 20 Å2, 1.20σ; (c) 40 Å2, 1.24σ; (d) 60 Å2, 1.30σ; (e) 80 Å2, 1.36σ; (f) 100 Å2, 1.41σ; (g) 120 Å2, 1.49σ. Maps were drawn with Coot (Emsley et al., 2010 ▸) and RASTER3D (Merritt & Bacon, 1997 ▸).
Figure 7
Figure 7
Map–model correlation as a function of overall B value for sharpened maps. (a) Analysis of the maps in Fig. 5 ▸. (b) Analysis of the maps in Fig. 6 ▸. (c) Analysis of the effects of model error on the overall B values maximizing map–model correlation. The maps are of variable quality, with the map–model correlation (CC) between the original model with B values set to zero. Blue, CC = 0.98; orange, CC = 0.78; black, CC = 0.63; yellow, CC = 0.50; green, CC = 0.42. See the text for details.
Figure 8
Figure 8
Comparison of the overall B values obtained by automatic sharpening with those obtained by direct maximization of map–model correlation.
Figure 9
Figure 9
Map–model correlation for automatically sharpened and deposited cryo-EM maps. (a) Comparison of the original maps and maps sharpened by maximization of the adjusted surface area. The ordinate is the map–model correlation (calculated using model B values of zero) for the deposited maps; the abscissa is the map–model correlation for the automatically sharpened maps. (b) Comparison of maps sharpened using half-map-based sharpening with maps sharpened with maximization of the adjusted surface area. (c) Comparison of maps sharpened using maximization of kurtosis with maps sharpened with maximization of the adjusted surface area. (d) Comparison of maps sharpened using of map–model correlation with maps sharpened with maximization of the adjusted surface area.
Figure 10
Figure 10
Comparison of map–model correlations using global versus local sharpening. (a) Sharpening using maximization of the adjusted surface area. (b) Sharpening using half-map correlation. (c) Model-based sharpening.
Figure 11
Figure 11
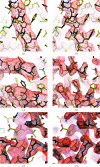
Auto-sharpening applied to maps from the EMDB. The maps shown are among those that showed the greatest improvement in map correlation using phenix.auto_sharpen. Contours are chosen to yield equal volumes inside contours in each map (Urzhumtsev et al., 2014 ▸). Maps were drawn with Coot (Emsley et al., 2010 ▸) and RASTER3D (Merritt & Bacon, 1997 ▸). (a, b) Map of the high-conductance Ca2+-activated K+ channel (EMD-8414 and PDB entry 5tji; Hite et al., 2017 ▸) before and after the application of sharpening. The original and final values of overall B iso and the contour levels used are as follows: (a) 260 Å2, 1.57σ; (b) 20 Å2, 1.5σ. (c, d) Map of the cystic fibrosis transmembrane conductance regulator (EMD-8461 and PDB entry 5uar; Zhang & Chen, 2016 ▸) before and after the application of sharpening. The original and final values of overall B iso and the contour levels used are as follows: (c) 290 Å2, 1.01σ; (d) −60 Å2, 1.0σ. (e, f) Map of lactate dehydrogenase (EMD-8191 and PDB entry 5k0z; Merk et al., 2016 ▸) before and after the application of sharpening. The original and final values of overall B iso and the contour levels used are as follows: (e) 102 Å2, 2.47σ; (f) −20 Å2, 2.0σ.

References

    1. Adams, P. D. et al. (2010). Acta Cryst. D66, 213–221. - PubMed
    1. Afonine, P. V., Moriarty, N. W., Mustyakimov, M., Sobolev, O. V., Terwilliger, T. C., Turk, D., Urzhumtsev, A. & Adams, P. D. (2015). Acta Cryst. D71, 646–666. - PMC - PubMed
    1. Afonine, P. V., Poon, B. K., Read, R. J., Sobolev, O. V., Terwilliger, T. C., Urzhumtsev, A. & Adams, P. D. (2018). bioRxiv, 249607. https://doi.org/10.1101/249607.
    1. Baldwin, P. R., Tan, Y. Z., Eng, E. T., Rice, W. J., Noble, A. J., Negro, C. J., Cianfrocco, M. A., Potter, C. S. & Carragher, B. (2018). Curr. Opin. Microbiol. 43, 1–8. - PMC - PubMed
    1. Berman, H. M., Westbrook, J., Feng, Z., Gilliland, G., Bhat, T. N., Weissig, H., Shindyalov, I. N. & Bourne, P. E. (2000). Nucleic Acids Res. 28, 235–242. - PMC - PubMed

Publication types