Review
. 2018 Jun 1;74(Pt 6):560-571.
doi: 10.1107/S2059798318006496. Epub 2018 May 18.

Approaches to altering particle distributions in cryo-electron microscopy sample preparation

Affiliations
Review

Approaches to altering particle distributions in cryo-electron microscopy sample preparation

Ieva Drulyte et al. Acta Crystallogr D Struct Biol. .

Abstract

Cryo-electron microscopy (cryo-EM) can now be used to determine high-resolution structural information on a diverse range of biological specimens. Recent advances have been driven primarily by developments in microscopes and detectors, and through advances in image-processing software. However, for many single-particle cryo-EM projects, major bottlenecks currently remain at the sample-preparation stage; obtaining cryo-EM grids of sufficient quality for high-resolution single-particle analysis can require the careful optimization of many variables. Common hurdles to overcome include problems associated with the sample itself (buffer components, labile complexes), sample distribution (obtaining the correct concentration, affinity for the support film), preferred orientation, and poor reproducibility of the grid-making process within and between batches. This review outlines a number of methodologies used within the electron-microscopy community to address these challenges, providing a range of approaches which may aid in obtaining optimal grids for high-resolution data collection.

Keywords: cryo-electron microscopy; single-particle analysis; single-particle sample preparation.


Figures

Figure 1
Figure 1
Schematic representations of macromolecular complexes distributed in a vitreous ice layer. Top panels, views from the top; bottom panels, views from the side. (a) Ideal vitrified sample exhibiting well dispersed particles adopting random particle orientations. (b) Thinning of the ice in the centre of the hole pushes particles towards the carbon edge, excluding any from the middle and causing particle aggregation. (c) Specimen exhibits high affinity for the support and is excluded from the holes. (d) Particles adopt a preferential orientation.
Figure 2
Figure 2
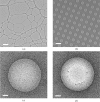
Effect of hole size on thin films and particle distributions. (a) A lacey grid with an irregular distribution of hole sizes and shapes. (b) A Quantifoil R1.2/1.3 with a regular distribution of evenly sized holes. (c) An even distribution of ice across the hole as seen for the R1.2/1.3 grids. (d) An example of broken substrate in the hole centre. (e) Thin ice in the centre of the hole excluding the virus and causing it to clump towards the edge of the hole. (f) Virus particles forming a semi-ordered array in the area of thin ice. (g) An example of a 750 kDa multiprotein complex disassociating in the large holes of lacey carbon. (h) The same multiprotein complex remains intact and with a range of angular distributions in the smaller holes of lacey carbon. Scale bars: (a), (b) 2 µm; (c), (d), (f) 200 nm; (e) 100 nm; (g), (h) 50 nm.
Figure 2
Figure 2
Effect of hole size on thin films and particle distributions. (a) A lacey grid with an irregular distribution of hole sizes and shapes. (b) A Quantifoil R1.2/1.3 with a regular distribution of evenly sized holes. (c) An even distribution of ice across the hole as seen for the R1.2/1.3 grids. (d) An example of broken substrate in the hole centre. (e) Thin ice in the centre of the hole excluding the virus and causing it to clump towards the edge of the hole. (f) Virus particles forming a semi-ordered array in the area of thin ice. (g) An example of a 750 kDa multiprotein complex disassociating in the large holes of lacey carbon. (h) The same multiprotein complex remains intact and with a range of angular distributions in the smaller holes of lacey carbon. Scale bars: (a), (b) 2 µm; (c), (d), (f) 200 nm; (e) 100 nm; (g), (h) 50 nm.
Figure 3
Figure 3
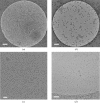
The use of continuous support films. (a) Holey grid showing few virus particles in the vitrified ice. (b) Continuous carbon grid prepared with the same concentration of virus as in (a), showing a drastic increase in the number of virus particles observed. (c) Representative micrograph of a holey grid showing the extreme preferred orientation of β-galactosidase particles. (d) Representative micrograph of a continuous graphene oxide grid with a significantly improved angular distribution of β-galactosidase particles. Scale bars: (a), (b) 200 nm; (c), (d) 50 nm.
Figure 4
Figure 4
Practical applications of continuous carbon supports. (a)–(c) Avoiding aggregation by immobilizing the virus prior to the addition of a binding protein, (d)–(f) grid soaking with low-affinity receptor molecules. (a) An example of a virus-only sample distributed evenly across a holey grid. (b) Aggregates are observed on a grid after virus and non-antibody binding protein are mixed in solution. (c) Virus and non-antibody binding protein complexes are distributed evenly across a grid. Virus sample was applied to a lacey grid with a 3 nm continuous carbon support (Agar Scientific) and the excess solution was blotted away; the binding protein was then applied and the excess was washed away with buffer before blotting and plunge freezing. (d) Virus-only sample distributed evenly across a lacey grid with a 3 nm continuous carbon support (Agar Scientific). Owing to the low concentration of the sample and its intractability to concentration, multiple aliquots of virus sample were applied to the grid prior to blotting and plunge freezing. (e) Virus and 20 mM solution of receptor fragment. Excess virus sample was applied to a grid and blotted away before the concentrated receptor solution was applied. This was left to dwell for 30 s prior to blotting and plunge freezing. (f) EM density (2.8σ) and fitted model for a terminal sialic acid present in the low-affinity receptor fragment. Scale bars: (a)–(c) 100 nm; (d), (e) 50 nm.
Figure 5
Figure 5
Altering both the time and the strength of plasma treatment can dramatically alter the particle distribution. Representative micrographs of (a) very few 600 kDa oligomeric protein complex particles observed on a grid glow discharged using a PELCO easiGlow at 20 mA for 60 s and (b) a nice distribution of the same protein complex observed on a grid glow discharged using a Cressington 208 at 10 mA for 90 s. Scale bars are 50 nm.

Similar articles

Cited by

References

    1. Amporndanai, K., Johnson, R. M., O’Neill, P. M., Fishwick, C. W. G., Jamson, A. H., Rawson, S., Muench, S. P., Hasnain, S. S. & Antonyuk, S. V. (2018). IUCrJ, 5, 200–210. - PMC - PubMed
    1. Arnold, S. A., Albiez, S., Bieri, A., Syntychaki, A., Adaixo, R., McLeod, R. A., Goldie, K. N., Stahlberg, H. & Braun, T. (2017). J. Struct. Biol. 197, 220–226. - PubMed
    1. Arteni, A. A., Ajlani, G. & Boekema, E. J. (2009). Biochim. Biophys. Acta, 1787, 272–279. - PubMed
    1. Baggen, J. et al. (2018). Proc. Natl Acad. Sci. USA, 115, 397–402. - PubMed
    1. Benjamin, C. J., Wright, K. J., Hyun, S.-H., Krynski, K., Yu, G., Bajaj, R., Guo, F., Stauffacher, C. V., Jiang, W. & Thompson, D. H. (2016). Langmuir, 32, 551–559. - PMC - PubMed

Publication types

MeSH terms

Substances