. 2018 Jun 1;74(Pt 6):572-584.
doi: 10.1107/S2059798318001948. Epub 2018 Apr 11.

Microtubule architecture in vitro and in cells revealed by cryo-electron tomography

Affiliations

Microtubule architecture in vitro and in cells revealed by cryo-electron tomography

Joseph Atherton et al. Acta Crystallogr D Struct Biol. .

Abstract

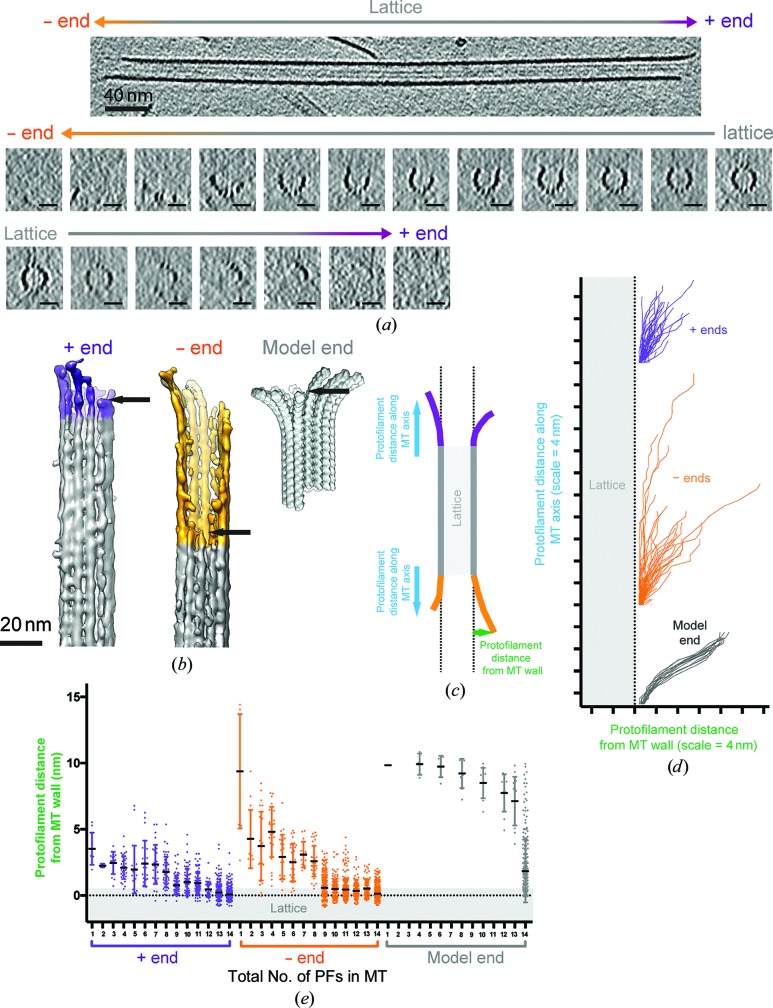
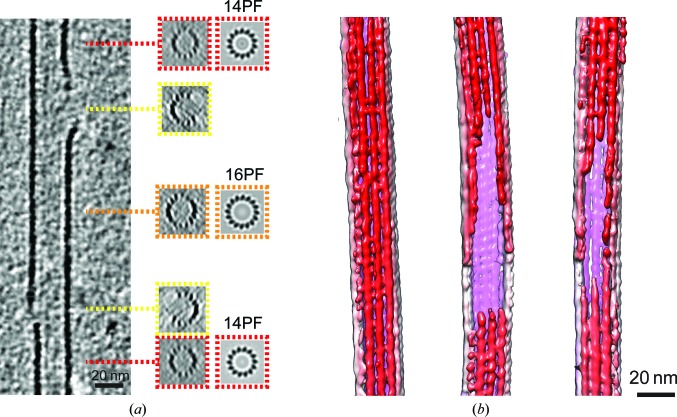
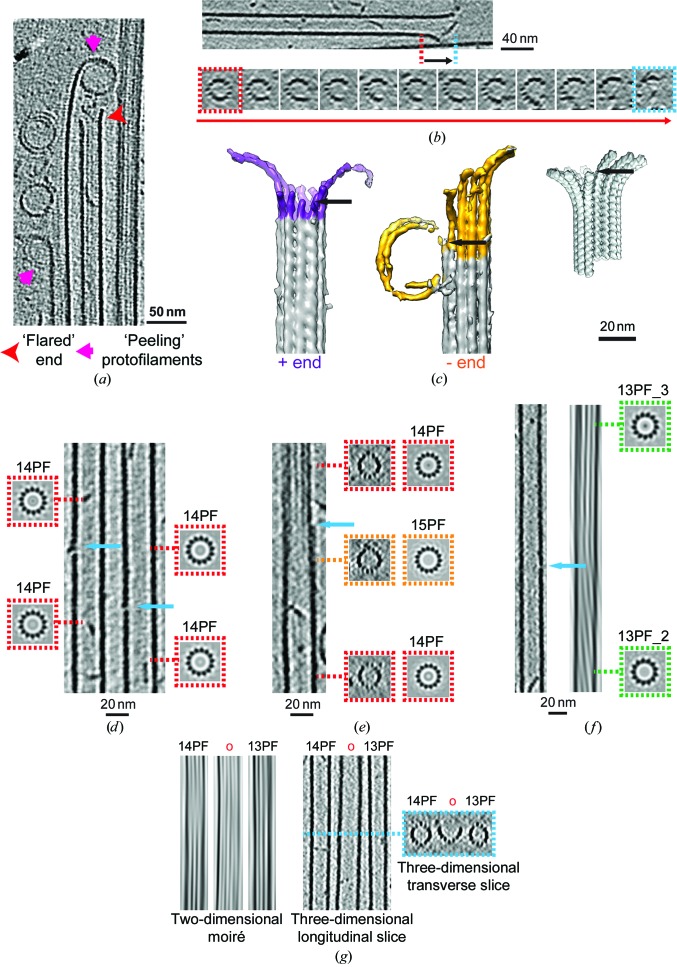
The microtubule cytoskeleton is involved in many vital cellular processes. Microtubules act as tracks for molecular motors, and their polymerization and depolymerization can be harnessed to generate force. The structures of microtubules provide key information about the mechanisms by which their cellular roles are accomplished and the physiological context in which these roles are performed. Cryo-electron microscopy allows the visualization of in vitro-polymerized microtubules and has provided important insights into their overall morphology and the influence of a range of factors on their structure and dynamics. Cryo-electron tomography can be used to determine the unique three-dimensional structure of individual microtubules and their ends. Here, a previous cryo-electron tomography study of in vitro-polymerized GMPCPP-stabilized microtubules is revisited, the findings are compared with new tomograms of dynamic in vitro and cellular microtubules, and the information that can be extracted from such data is highlighted. The analysis shows the surprising structural heterogeneity of in vitro-polymerized microtubules. Lattice defects can be observed both in vitro and in cells. The shared ultrastructural properties in these different populations emphasize the relevance of three-dimensional structures of in vitro microtubules for understanding microtubule cellular functions.

Keywords: cryo-electron tomography; lattice defects; microtubules; neurons; three-dimensional reconstruction.


Figures

Figure 1
Figure 1
GMPCPP-stabilized in vitro-polymerized MTs visualized by cryo-electron tomography. (a) Top, 0° tilt image (motion-corrected movie sum) from a tilt series, showing a typical field of MTs that includes views of the MT lattice (red arrowhead, including the moiré pattern) and MT ends (pink arrow), together with 10 nm nanogold fiducial markers (black arrows). Bottom, 8 nm section through the three-dimensional tomographic reconstruction of the same sample, showing the appearance of sections through the MT wall (red arrowhead) in which individual PFs are visible, the MT lumen (orange arrowhead) and MT ends (pink arrow). Inset: Fourier transform of an extracted MT showing a layer line corresponding to the 4 nm spacing of the tubulin monomers within the MT lattice, indicative of the level of structural detail in these data. (b) An exemplar MT image (0° tilt image; left) and Fourier filtered image (right) showing the moiré pattern characteristic of a 14PF MT (black arrows). The arrowhead shapes within the moiré pattern (red arrowheads) indicate the MT polarity, with the MT plus end towards the top in this case. (c) Rotational averaging analysis of 8 nm thick transverse sections from the tomographic reconstruction supports the moiré-pattern-based assignment of 14PF architecture for this MT, yielding clear PF projections in the 14-­fold average, while 13-fold or 15-fold averaging of the same data blurs out structural information from the characteristic PF projection. (d) Transverse section (top) and segmented and surface-rendered view (bottom) through the same three-dimensional tomogram, showing the distribution of the MTs (red) in the vitreous ice layer (indicated by the shaded area) and the tendency of the background protein (tubulin, yellow) to lie at the air–water interface of the sample. This view also shows the distorting effect of the missing wedge on the MT structure, illustrating the difficulty of directly counting PFs in such data.
Figure 2
Figure 2
GMPCPP MT end structure visualized by cryo-electron tomography. (a) Top, longitudinal slice through the tomographic reconstruction, showing an MT in which both plus and minus ends (as indicated and assigned using the moiré pattern) are visible. Bottom, a series of ∼5 nm transverse sections through the tomographic reconstruction showing the transition from lattice to end. At both ends the cylindrical organization of the MT is retained even as PFs are lost, until a critical point (see below) when the PFs curve gently away from the MT axis in a sheet, often remaining laterally connected until the very end of the MT. (b) Segmented and three-dimensional surface-rendered volumes of a plus (purple) and minus (yellow) MT end and a model minus-end volume constructed from straight (PDB entry 3jat; Zhang et al., 2015 ▸) and curved (PDB entry 3ryh; Nawrotek et al., 2011 ▸) tubulin conformations; the arrow indicates the beginning of tapering along the MT axis in each case. PDB entry 3ryh at 9.5° curvature was selected because it is a curved GTP-bound structure of four monomers in length that is useful for model building, but numerous structures of curved tubulin have been determined that show a range of curvatures (∼9.5–13°; for a review and calculation of curvature, see Brouhard & Rice, 2016 ▸). (c) Schematic representation of the PF position at MT ends relative to the MT wall. (d) Graphical representation from subtomograms of five plus (purple) and five minus (yellow) ends, plotting three-dimensional PF trajectories as they transition from MT lattice to MT end. These plots show that while there is a range of PF curvature and length at MT ends, PFs at plus and minus ends are not as curved as a PDB-based model PF; for the plus end n = 62 PFs and for the minus end n = 63 PFs. (e) Graphical representation from five subtomogram(s) of the loss of PFs from MT ends showing that at both ends, after approximately five PFs are lost from the 14PF architecture, the remaining PFs abruptly start curving outward as an MT sheet, i.e. in our data GMPCPP MTs need at least ∼9 PFs to maintain their cylindrical structure. The model end (grey) is built such that curved and lattice-constrained PFs superimpose on each other, leading to the data spread in the plot. In each case, whisker plots show the mean ± standard deviation, with individual measurements for all PFs shown as a scatter plot.
Figure 3
Figure 3
Cryo-electron tomography of GMPCPP MTs reveals lattice defects. (a) Longitudinal section through a three-dimensional tomographic reconstruction in which two different lattice defects are visible. Insets, transverse sections through the same MT with the position of the section relative to the polymer and their rotational average indicated in colour. These show the PF mismatches at the defects. (b) Three-dimensional rendering of examples of MTs with the near-surface MT coloured red and more distant MT surfaces coloured pink; left, an MT without a defect; middle and right, different MTs with lattice defects.
Figure 4
Figure 4
Dynamic in vitro-polymerized MTs visualized by cryo-electron tomography. (a) Top, 0° tilt image (motion-corrected movie sum; ∼2 e Å−2 total dose) from a tilt series, showing a typical field of MTs that includes views of the MT lattice (red arrowheads, including the moiré pattern) and MT ends (pink arrows), together with 10 nm gold fiducial markers. Bottom, 8 nm section through the three-dimensional tomographic reconstruction of the same sample, showing the appearance of sections through the MT wall (red arrowhead) in which individual PFs are visible, the MT lumen (orange arrowheads), MT ends (pink arrow), tubulin PF spirals (blue arrows) and unpolymerized tubulin (yellow arrows). (b) Exemplar 0° tilt MT image (left) and Fourier filtered image (right) showing the moiré patterns characteristic of (i) a 14PF MT and (ii) a 13PF MT. Because the 14PF MT is not sitting perfectly flat within the plane of the vitreous ice, the arrowhead shape within the moiré pattern that might be used to indicate MT polarity is not visible, but its polarity was determined using the change in appearance of the moiré pattern with the tilt angle. Because the PFs lie parallel to the MT axis in the architecture of the 13PF MT, the moiré pattern does not vary along the MT length and its polarity cannot be determined using this approach. (c) Rotational averaging analysis of 8 nm thick transverse sections from the tomographic reconstruction supports the moiré-pattern-based assignment of PF architecture for these MTs. (d) Transverse section (top) and segmented and surface-rendered view (bottom) through the same tomogram, showing the distribution of the MTs (red) in the vitreous ice layer, the tendency of background protein (tubulin, yellow) to lie more at the air–water interface of the sample and the tendency of the tubulin spirals (blue) to lie horizontally at the centre of the ice layer.
Figure 5
Figure 5
Dynamic MT end structure visualized in vitro by cryo-electron tomography. (a) Longitudinal slice through the tomographic reconstruction, showing a range of MT end morphologies including the highly characteristic ‘rams horn’-like appearance associated with depolymerizing MTs (pink arrows) and the relatively short flared region associated with growing MTs (red arrowhead). (b) Top, longitudinal slice through the tomographic reconstruction, showing a dynamic MT (of unknown polarity) in which one end is visible. Bottom, a series of transverse sections through the tomographic reconstruction, showing the transition from lattice to end. As was seen in GMPCPP MTs (Fig. 2 ▸ a), the cylindrical organization of the MT is retained even as PFs are lost, until a critical point when the PFs curve gently away from the MT axis in a sheet, often remaining laterally connected until the very end of the MT. (c) Three-dimensional surface rendering of plus (purple, left) and minus (yellow, middle) depolymerizing MT ends compared with a model MT end as described for Fig. 2 ▸(b). A range of tubulin curvature is observed in minus and plus ends, with peeling PFs exhibiting a similar curvature to curved tubulin PDB structures. (d) Centre, longitudinal section through a tomogram of two MTs each with a small lattice defect indicated by blue arrows. Insets, transverse sections through these MTs with positions of sections relative to the MT and their rotational average indicated in colour. (e) Left, longitudinal section through a tomogram of an MT, with a blue arrow indicating a small lattice defect. Insets, transverse sections through the same MT with the position of sections relative to the polymer and their rotational average indicated in colour, showing the change in PF number that coincides with the defect. (f) Left, longitudinal section through a tomogram of a 13PF MT, with a blue arrow indicating a small lattice defect that coincides with a change in helical symmetry. Insets; centre, Fourier filtered two-dimensional projection of this MT, showing a change in characteristic moiré pattern from a 13PF with a 3-start (top section) to a 13PF with a 2-start (bottom section); right, transverse sections through the same MT with the position of the section relative to the polymer and their rotational average indicated in colour. (g) Left, Fourier filtered two-dimensional projection image of three MTs: a 14PF (left), a 13PF (right) and an incomplete tube (centre, red ‘o’ for ‘open’). Centre, longitudinal slice through a three-dimensional tomogram of the three MTs. Right; transverse slice, at the position indicated with a light blue dashed line, through the three-dimensional tomogram of the three MTs. Note the less complex moiré pattern of the incomplete tube because only a single polymer surface is projected in the image.
Figure 6
Figure 6
Characterization of MTs in cultured mouse neurons. (a) Phase-contrast light-microscope overview of mouse cortical neurons growing on cryo-EM grids. (b) Top, 0° tilt image (motion-corrected movie sum; 2.7 e Å−1 total dose) showing a view of the periphery of a neuron lying across a hole in the cryo-EM grid carbon layer, in which numerous cellular components, including MTs (four are labelled i–iv), are visible. Bottom, 8 nm section through the three-dimensional tomographic reconstruction of the same sample, showing the appearance of sections through the MT wall (red arrowheads), the MT lumen (orange arrowheads), MT ends (pink arrows), actin filaments (green arrows) and membranous organelles (black arrows). (c) Top, Fourier filtered images of the selected four MTs in (a) are shown, which reveal the unvarying moiré pattern typical of 13PF MTs seen in all neuronal MTs examined (n = 61). For a comparison with the PF distribution of in vitro-polymerized mouse brain tubulin, see Vemu et al. (2017 ▸).
Figure 7
Figure 7
Diversity of MT ultrastructure in neurons. (a) A range of particle sizes and distributions are seen in the lumen of neuronal MTs. (b) The majority (24/25) of neuronal MT ends have relatively short flared regions similar to those observed in GMPCPP-stabilized MTs (Fig. 2 ▸ a), while only one example of a longer curved sheet extension was seen and no highly curved ends associated with in vitro depolymerizing MTs (Fig. 5 ▸ a) were observed. (c) Three examples of lattice defects observed in neuronal MTs. In each case, a section through the tomogram is depicted on the left and a surface rendering of the MT wall is shown on the right.

References

    1. Adrian, M., Dubochet, J., Lepault, J. & McDowall, A. W. (1984). Nature (London), 308, 32–36. - PubMed
    1. Akhmanova, A. & Steinmetz, M. O. (2015). Nature Rev. Mol. Cell Biol. 16, 711–726. - PubMed
    1. Alushin, G. M., Lander, G. C., Kellogg, E. H., Zhang, R., Baker, D. & Nogales, E. (2014). Cell, 157, 1117–1129. - PMC - PubMed
    1. Atherton, J. et al. (2017). Nature Struct. Mol. Biol. 24, 931–943. - PMC - PubMed
    1. Aumeier, C., Schaedel, L., Gaillard, J., John, K., Blanchoin, L. & Théry, M. (2016). Nature Cell Biol. 18, 1054–1064. - PMC - PubMed

Publication types