. 2018 Jun 5;9(1):2185.
doi: 10.1038/s41467-018-04589-8.

Variable number of TMC1-dependent mechanotransducer channels underlie tonotopic conductance gradients in the cochlea

Affiliations

Variable number of TMC1-dependent mechanotransducer channels underlie tonotopic conductance gradients in the cochlea

Maryline Beurg et al. Nat Commun. .

Abstract

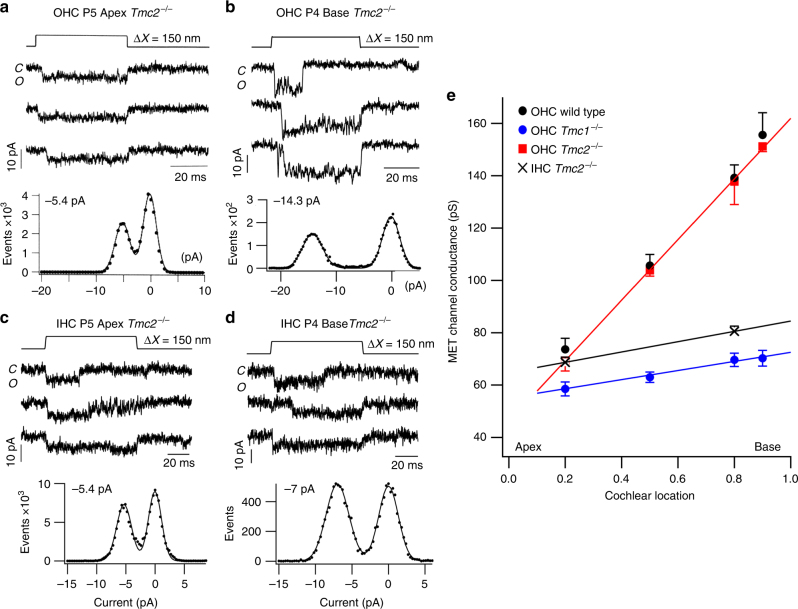
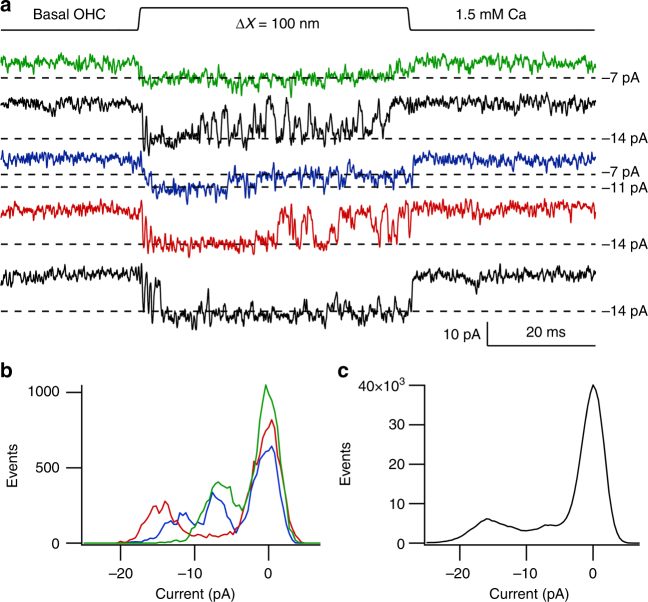
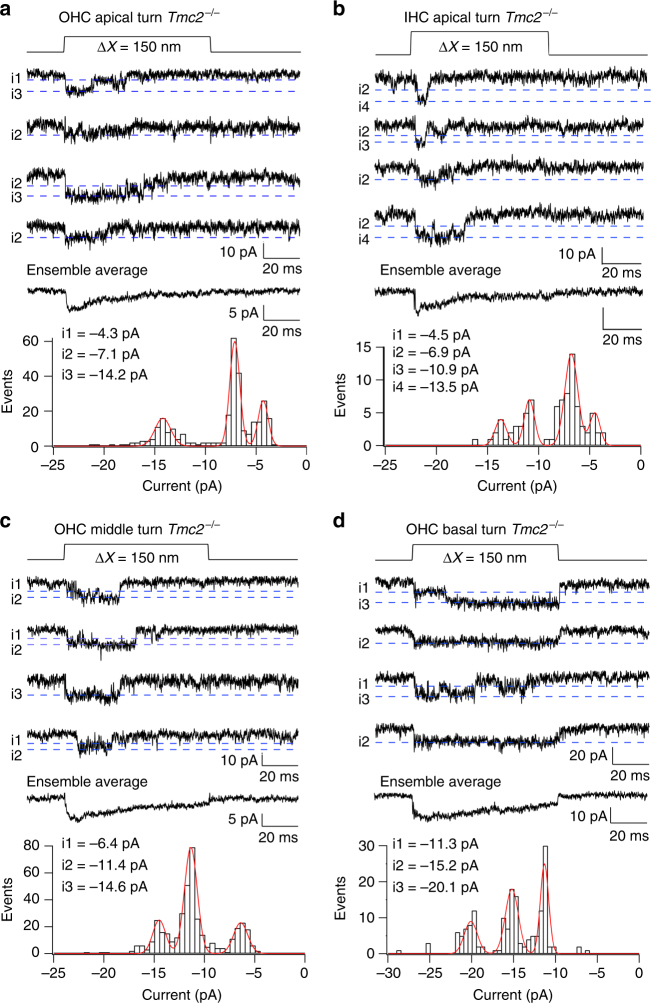
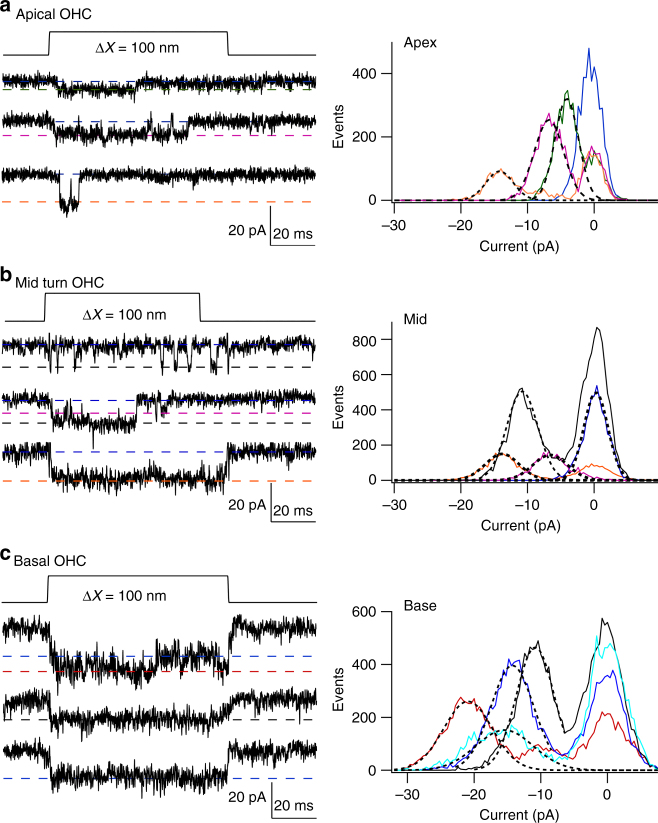
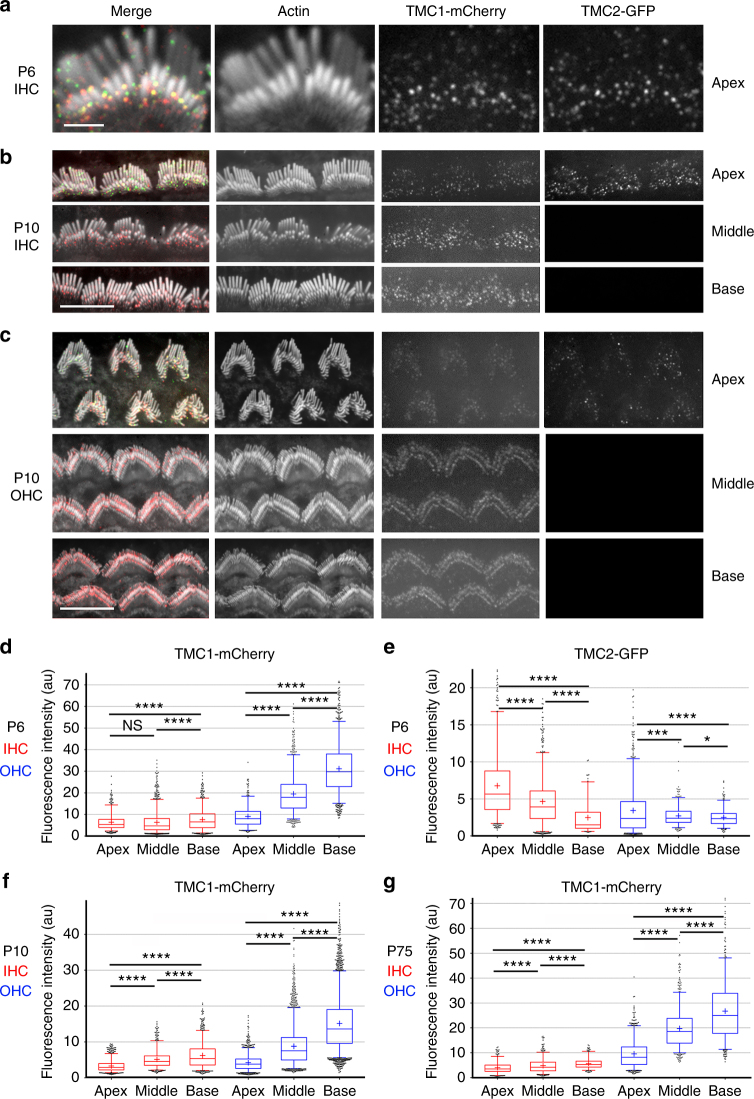
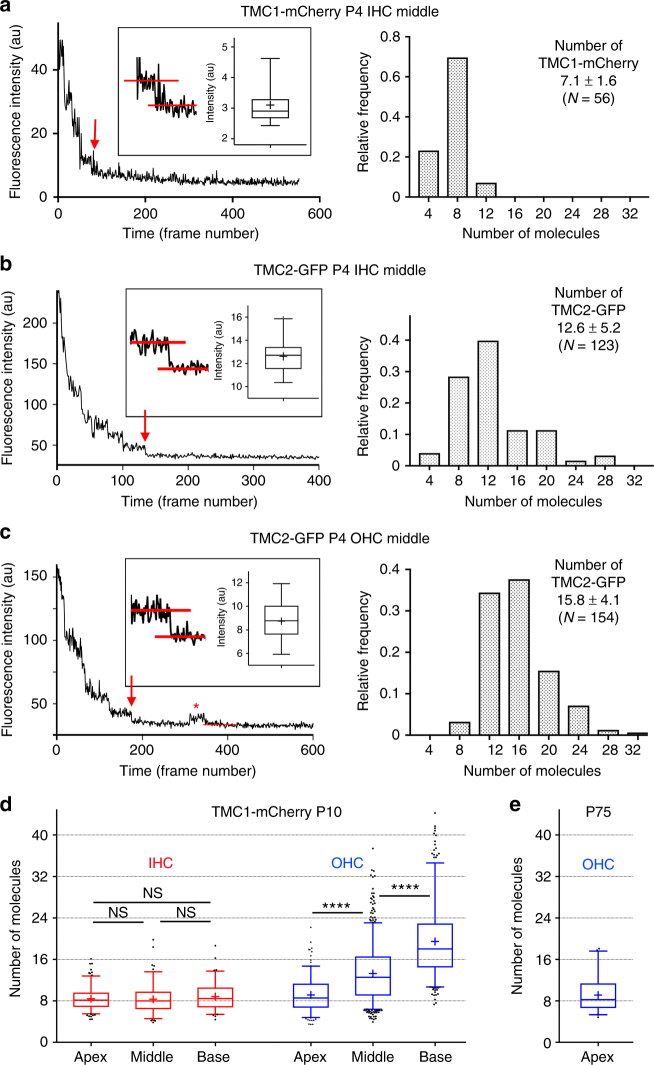
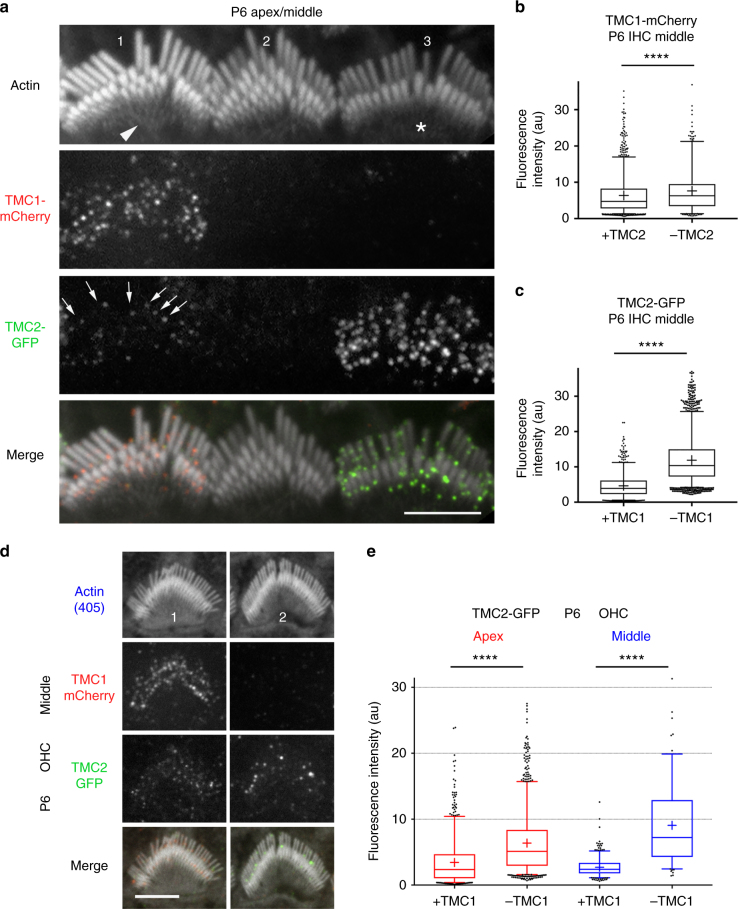
Functional mechanoelectrical transduction (MET) channels of cochlear hair cells require the presence of transmembrane channel-like protein isoforms TMC1 or TMC2. We show that TMCs are required for normal stereociliary bundle development and distinctively influence channel properties. TMC1-dependent channels have larger single-channel conductance and in outer hair cells (OHCs) support a tonotopic apex-to-base conductance gradient. Each MET channel complex exhibits multiple conductance states in ~50 pS increments, basal MET channels having more large-conductance levels. Using mice expressing fluorescently tagged TMCs, we show a three-fold increase in number of TMC1 molecules per stereocilium tip from cochlear apex to base, mirroring the channel conductance gradient in OHCs. Single-molecule photobleaching indicates the number of TMC1 molecules per MET complex changes from ~8 at the apex to ~20 at base. The results suggest there are varying numbers of channels per MET complex, each requiring multiple TMC1 molecules, and together operating in a coordinated or cooperative manner.


Conflict of interest statement

The authors declare no competing interests.

Figures

Fig. 1
Fig. 1
Contribution of TMC2 to development of mechanotransduction in OHCs and IHCs. a Examples of maximum MET currents of wild-type apical OHCs during the first postnatal week, ages P2, P5, and P8. Top trace denotes timing of 100 nm amplitude sinusoidal vibration of the hair bundle evoked by a fluid jet stimulator. b MET currents in Tmc2−/− in apical OHCs. c MET currents in Tmc1−/− mouse apical OHCs. d MET current amplitudes (mean ± SEM) in wild type (WT; black symbols) and Tmc2−/− (red symbols) in OHCs from cochlear apex and base. Numbers of OHCs for points with increasing age: apex WT, 13, 6, 5, 8, 6, 6, 5; apex Tmc2−/−, 3, 3, 3, 5,7, 5, 6, 3, 3; apex Tmc1−/−: 3, 8, 5, 4, 7, 9, 3, 6, 8, 6, 3; base WT: 7, 7, 4, 7, 9, 12, 7, 3; base Tmc2−/−: 3, 3, 4, 5, 5, 4, 4, 3. e Expression of TMC2 in apical OHCs, derived as the difference between wild type and Tmc2−/− (crosses) and from Tmc1−/− mice (open symbols); points fit with Gaussian curves. Numbers of cells: WT, 5 to 13; Tmc2−/− mice 3 to 7. Tmc1−/− mice 5 to 7. f Examples of maximum MET currents during development of wild type apical IHCs at postnatal ages P2, P5 and P8. g MET currents during same period in apical IHCs from Tmc2−/− mice. h MET currents in apical IHCs from Tmc1−/− mice at postnatal ages P2, P5, and P8. i MET currents (mean ± SEM) in wild type (black symbols) and Tmc2−/− (red symbols). j Expression of TMC2 in IHCs, derived as the difference between wild type and Tmc2−/− (blue crosses, fit with blue dashed line) and from Tmc1−/− mice (open symbols, fit with black dashed line). Numbers of cells, increasing in age: IHC, WT: 5, 10, 6, 10, 6, 6, 5, 4, 4, 4; IHC Tmc2−/− 3, 9, 11, 8, 6, 7, 6, 5, 3, 3; IHC Tmc1−/− 3, 4, 5, 3, 4, 5, 4, 4, 4, 4, 3. Holding potential −84 mV
Fig. 2
Fig. 2
Tonotopic organization of MET channels. a Three examples of single-channel currents in response to hair bundle deflection (top) in P5 apical Tmc2−/− mice. Amplitude histogram of events gives −5.4 pA single-channel current. b Three examples of single-channel currents in P4 basal OHC; amplitude histogram of events gives −14.3 pA single-channel current. Holding potential −84 mV. c Three examples of single-channel currents evoked in apical IHC of P5 Tmc2−/− mice. Amplitude histogram of events gives 5.4 pA single-channel current. d Three examples of single-channel currents in P4 basal IHC; amplitude histogram of events gives 6.9 pA single-channel current. Holding potential −84 mV. e Collected results on MET channel conductance plotted against fractional distance along the cochlea from the apex, for OHCs of P3–P7 wild-type (black symbols), Tmc2−/− mice (red symbols), and Tmc1−/− mice (blue symbols) and for Tmc2−/− mouse IHCs (black crosses). Each point is the mean ± SEM; numbers of cells, apex to base: OHC wild type, 14, 4,14, 7; OHC Tmc2−/− 11, 4, 10, 3; OHC Tmc1−/−18, 3, 14, 3; IHC Tmc2−/− 7, 5. Lines drawn through points for Tmc2−/− and Tmc1−/− mice. MET channels for Tmc2−/− mice still exhibit a tonotopic conductance gradient like wild type, but the gradient is virtually absent in Tmc1−/− mice indicating the tonotopic conductance gradient is supported by TMC1 but not TMC2. All measurements in 1.5 mM extracellular Ca2+
Fig. 3
Fig. 3
Multiple single-channel levels in a basal OHC. a Five exemplar traces showing channel events during 100 nm bundle deflection. The principal current levels are indicated by dashed lines corresponding to −7, −11, and −14 pA. b Amplitude histograms of the three colored traces showing the three levels of −7, −11 and −14 pA. c Amplitude histogram of all 41 traces from this recording. The levels are smeared so it is difficult to infer specific levels other than the largest one. Note the smearing was not always evident (Fig. 2b). OHC from P4 Tmc2−/− mouse; 1.5 mM external Ca2+; holding potential −84 mV
Fig. 4
Fig. 4
MET single-channel distributions in OHCs and IHCs in Tmc2−/− mice. a Four examples of single-channel current events in a P4 apical OHC, and ensemble average of 100 presentations of this bundle stimulus. Amplitude histogram of current levels, shown below fitted with Gaussian of current levels i1, i2, and i3 denoted by blue dashed lines superimposed on single-channel traces. Current levels and standard deviation of Gaussian fits: −4.3, 0.5 pA; −7.1, 0.5 pA; −14., 0.7 pA. b Examples of single-channel current events in a P6 apical IHC, and ensemble average of 100 presentations of this bundle stimulus. Current levels and standard deviation: −4.5, 0.6 pA, −6.9, 0.7 pA; −10.9, 0.64 pA; −13.5, 0.64 pA. c Four examples of single-channel current events in P3 middle turn OHC, and ensemble average of 100 stimulus presentations. Current levels and standard deviation: −6.4, 0.7 pA; −11.4, 0.6 pA; −14.6, 0.6 pA. d Four examples of single-channel current events in P3 basal OHC and ensemble average of 100 presentations of this bundle stimulus at top. Current levels and standard deviation: ; −11.3, 0.5 pA; −15.2, 0.57 pA; −20.1, 0.7 pA. Holding potential −84 mV in all experiments. All measurements in low (0.04 mM) extracellular Ca2+
Fig. 5
Fig. 5
Histograms of multiple-level channel events. a Apical OHC, three traces of channel responses to 100 nm step deflection of the hair bundle, with peak levels (corresponding to xo values) drawn as dashed lines. Histograms of amplitude distributions of segments of these and three other traces, with different levels, fit with Gaussians = A exp{−(xxo)2/2σ2} (black dotted lines superimposed on noisy data) with values of xo and σ: −4.1, 1.7 pA; −6.7, 2.2 pA; −14.2, 2.1 pA. b Middle turn OHC, three traces. Gaussian fits with values of xo and σ: −6.6, 3.7 pA; −10.8, 3.3 pA; −13.8, 3.6 pA. For the brief openings, exemplified in top trace, five histograms were summed to produce the green curve. c Basal turn OHC, three traces, and Gaussian fits with values of xo and σ: −10.8, 2.8 pA; −14.2, 3.6 pA; −15.4, 4.2 pA; −20.9, 3.6 pA. holding potential −84 mV. For all locations, each amplitude histogram (color) represents the sum of multiple analyses. The analyses in (b) and (c) are from the same pool of data as in Fig. 4c, d
Fig. 6
Fig. 6
TMC levels in stereocilia show tonotopic gradients. a Leftmost panel, IHC stereocilia (stained for actin with Alexa-405 phalloidin, shown in white) from the apical cochlear turn from a P6 mouse expressing TMC1-mCherry (red) and TMC2-GFP (green). Subsequent panels show individual channels, respectively: actin (white), TMC1-mCherry (red), and TMC2-GFP (green). Scale bar, 2 µm. b Confocal images of IHC bundles from P10 transgenic mouse showing that TMC1-mCherry is expressed throughout the cochlea (apex, middle, and base) but TMC2-GFP expression is restricted to an apical cochlear location, scale bar = 10 µm. c Confocal images of hair bundles from P10 transgenic mouse showing expression of TMC1-mCherry from an apical, middle, and basal cochlear location, TMC1 expression increasing from apex to base, scale bar = 10 µm. TMC2-GFP is only detected in apical OHCs. Box whisker plots of TMC1-mCherry puncta fluorescence intensity in P6 female (d), P10 male (f) and P75 female (g) mice, increasing almost three-fold from apex to base in OHCs at all ages, but only slightly in IHCs. e TMC2-GFP expression decreases from apex to base in P6 IHCs, and shows a relatively smaller decrease in OHCs. Box plot: Boxes represent 1st and 3rd quartile; central line depicts data median; “+” represents the mean; whiskers depict 5–95 percentile; and data points beyond the whiskers are outliers beyond the 5 or 95 percentile of all data. ****, p-value < 0.0001; ***, p-value < 0.001; *, p-value < 0.05. (Student’s t-test)
Fig. 7
Fig. 7
Bleaching and blinking steps of single TMC1-mCherry and TMC2-GFP puncta reveal the comprising number of molecules. a Left panel: time course of maximum fluorescence intensity of TMC1-mCherry puncta in IHC stereocilia at P4. Red arrow points to last bleaching step. Inset: box plot showing fluorescence intensity (mean ± SD) of final bleach step. Right panel: frequency distribution of number of TMC1-mCherry molecules within each fluorescent punctum. Mean of distribution ± SD. b, c Left panel: time course of integrated fluorescence intensity of TMC2-GFP puncta in IHC stereocilia at P4 (b), and TMC2-GFP puncta in OHC stereocilia at P4 (c). Red arrows point to final bleaching step. Inset: Box whisker plot showing fluorescence intensity (mean ± SD) of final bleach step. Asterisk highlights occasional blink after the GFP had reached the dark state. Right panels: frequency distribution of number of TMC2-GFP molecules within each fluorescent punctum. d Number of TMC1-mCherry molecules per fluorescence punctum increases from apex to base in OHC stereocilia at P10, but not in IHC stereocilia; number of measurements: IHC apex, N = 177; middle, N = 118; base, N = 99; OHC apex, N = 211; middle, N = 656; base, N = 355. e Number of TMC1-mCherry molecules per fluorescence punctum in apical OHC stereocilia at P75, N = 53. Box plot: whiskers, 5–95 percentile; +, mean. ****, p-value < 0.0001. (Student’s t-test; number of measurements indicated on plots; NS not significant)
Fig. 8
Fig. 8
TMC1 and TMC2 are required for normal stereocilia bundle development and morphology. a, b Confocal images of three IHC stereocilia bundles (1–3) from cochlear middle turn labeled with phalloidin (top panel), from transgenic mice aged P6 (a) and P7 (b), with a mosaic expression of TMC1-mCherry (second panel), and/or TMC2-GFP (third panel). Bottom panel—merge image of all three channels. Stereocilia bundles of IHCs that do not express TMC1-mCherry or TMC2-GFP (e.g., bundle 2 in a and b) are clearly developmentally immature relative to IHC bundles expressing either TMC1-mCherry or TMC2-GFP. c Confocal images of two adjacent IHC bundles from the cochlear apex (top two panels), middle (third panel) and base (fourth panel), from transgenic mice aged P3, with a mosaic expression of TMC1-mCherry, and no TMC2-GFP. One IHC lacks both TMCs, and the second expresses only TMC1-mCherry. Note that in the absence of TMC1 and TMC2, stereociliary bundles have extra rows and morphology remains similar at the apex, middle and base. Conversely, expression of TMC1-mCherry is necessary and sufficient for the normal reduction in number of stereocilia rows, and the subtle widening of the angle of the bundle “V”-shape from apex to base. Scale bar = 5 µm
Fig. 9
Fig. 9
TMC2-GFP levels in IHC and OHC stereocilia are influenced by TMC1-mCherry levels. a Confocal image of three IHC stereociliary bundles (bundles 1–3) from a P6 transgenic mouse with a mosaic expression of TMC1-mCherry (second panel), and/or TMC2-GFP (third panel). Some cells do not express any transgene (e.g., bundle 2). Bottom panel, merge image of all three channels. TMC2-GFP levels are comparatively lower (arrows in bundle 1) in the presence of TMC1-mCherry than in the absence of TMC1-mCherry (bundle 3). Note that relative to normal bundle morphology when both TMC1-mCherry and TMC2-GFP are expressed (bundle 1), bundle morphology is immature, with multiple stereocilia rows, when both TMC1 and TMC2 are missing (bundle 2), and more developed when TMC2-GFP is more highly expressed in the absence of TMC1-mCherry. b Relative fluorescence intensity of TMC1-mCherry puncta in IHC stereocilia at P6 in IHCs that express TMC2-GFP is slightly lower (6.4 ± 0.1 arbitrary units; N = 1315), compared with IHC that do not express TMC2-GFP (7.6 ± 0.3; N = 814). c Relative fluorescence intensity of TMC2-GFP puncta in IHC stereocilia at P6 increases significantly in IHCs that do not express TMC1-mCherry (11.9 ± 1.4; N = 2134), compared with IHCs that do express TMC1-mCherry (4.7 ± 0.1; N = 814). d Confocal images of two OHC stereocilia bundles (#1–2) from cochlear middle turn from transgenic mice (P6) with a mosaic expression of TMC1-mCherry (second panel), and/or TMC2-GFP (third panel). Bottom panel—merged image of all three channels. Note that TMC2-GFP puncta are brighter in absence of TMC1-mCherry. e Plot of relative fluorescence intensity of TMC2-GFP puncta in P6 OHCs at cochlear apex in presence (3.4 ± 1.2; N = 750) and absence (6.4 ± 1.3; N = 1252) of TMC1-mCherry; and at middle turns in presence (2.7 ± 0.1; N = 398) and absence (9.1 ± 0.5; N = 1151) of TMC1-mCherry. Scale bar = 5 µm. Box plot: whiskers, 5–95 percentile; +, mean. ****, p-value < 0.0001 (Student’s t-test; all values expressed as mean ± SD)

References

    1. Lim DJ, Anniko M. Developmental morphology of the mouse inner ear. A scanning electron microscopic observation. Acta Otolaryngol. Suppl. 1985;422:1–69. - PubMed
    1. Petit C, Richardson GP. Linking genes underlying deafness to hair-bundle development and function. Nat. Neurosci. 2009;12:703–710. doi: 10.1038/nn.2330. - DOI - PMC - PubMed
    1. Waguespack J, Salles FT, Kachar B, Ricci AJ. Stepwise morphological and functional maturation of mechanotransduction in rat outer hair cells. J. Neurosci. 2007;27:13890–13902. doi: 10.1523/JNEUROSCI.2159-07.2007. - DOI - PMC - PubMed
    1. Lelli A, Asai Y, Forge A, Holt JR, Geleoc GS. Tonotopic gradient in the developmental acquisition of sensory transduction in outer hair cells of the mouse cochlea. J. Neurophysiol. 2009;101:2961–2973. doi: 10.1152/jn.00136.2009. - DOI - PMC - PubMed
    1. Kim KX, Fettiplace R. Developmental changes in the cochlear hair cell mechanotransducer channel and their regulation by transmembrane channel-like proteins. J. Gen. Physiol. 2013;141:141–148. doi: 10.1085/jgp.201210913. - DOI - PMC - PubMed

Publication types

MeSH terms