. 2018 Jun 5;8(1):8652.
doi: 10.1038/s41598-018-26984-3.

GM-CSF targeted immunomodulation affects host response to M. tuberculosis infection

Affiliations

GM-CSF targeted immunomodulation affects host response to M. tuberculosis infection

Sulayman Benmerzoug et al. Sci Rep. .

Abstract

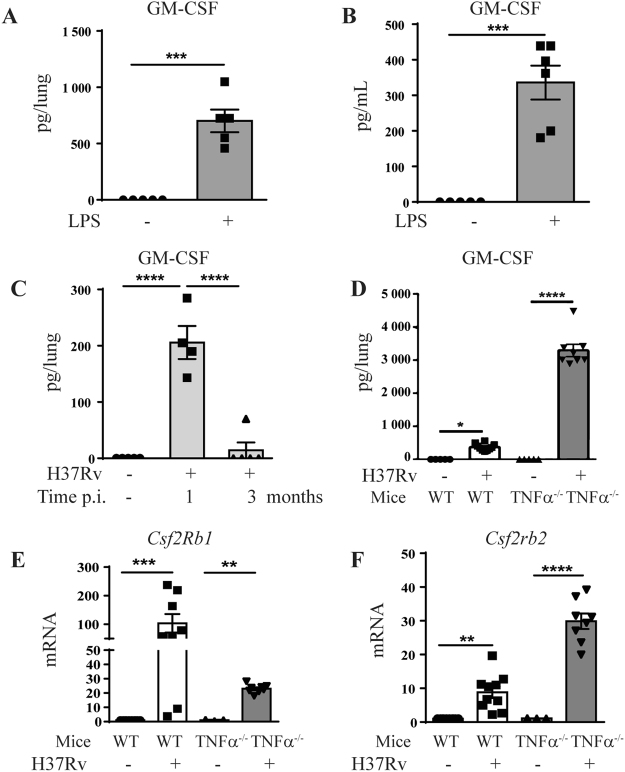
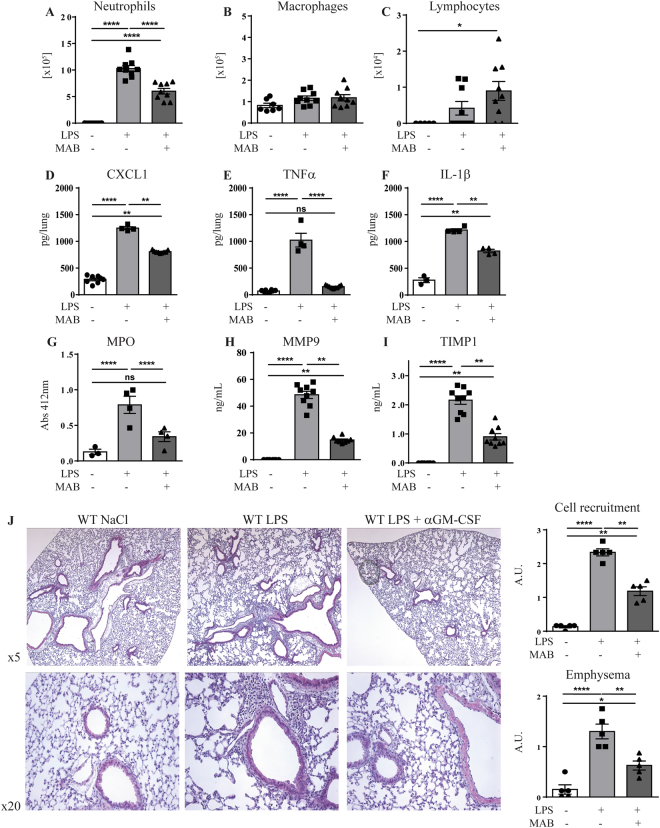
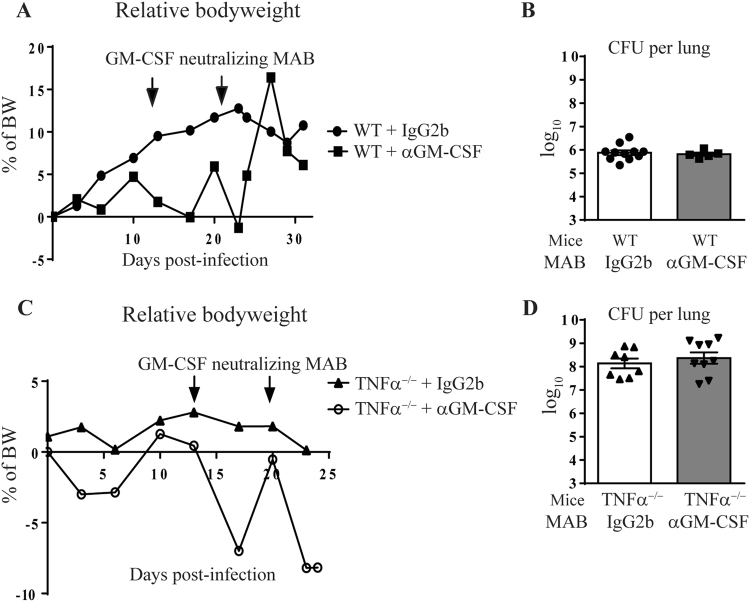
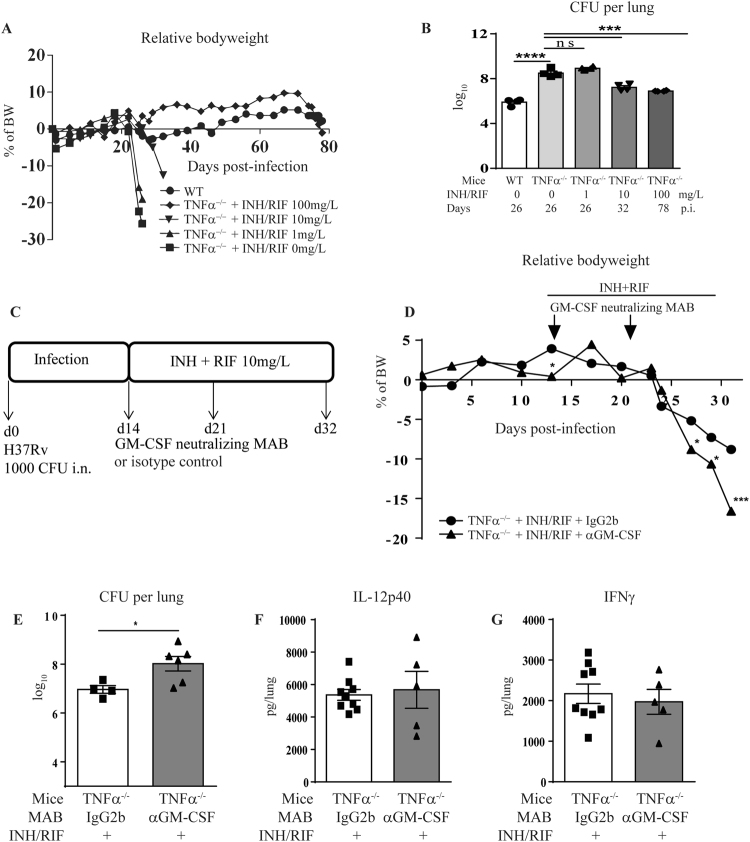
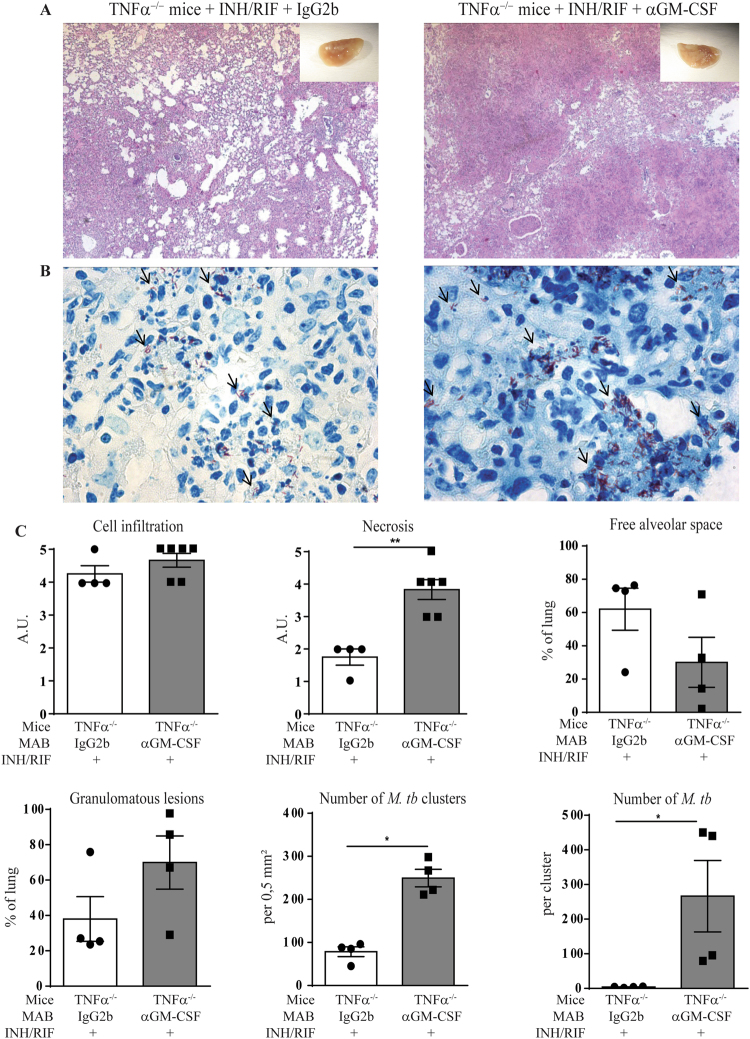
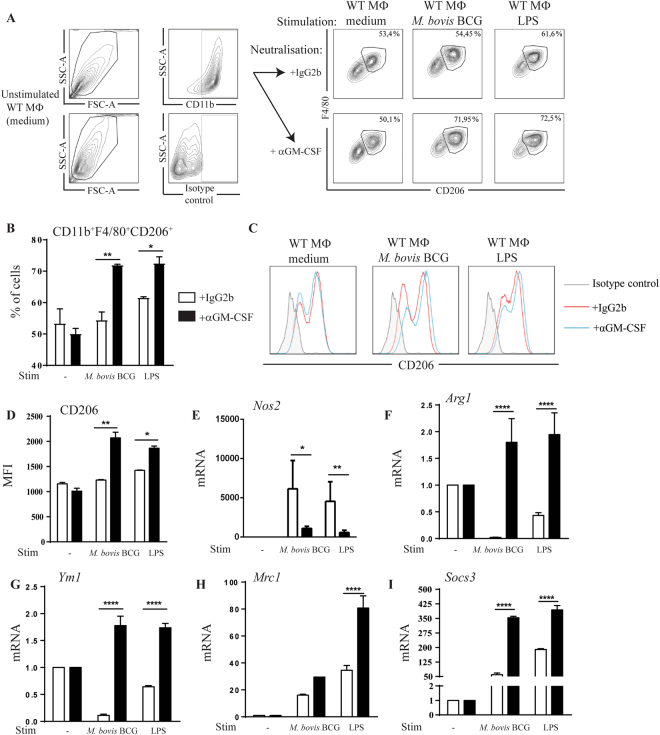
Host directed immunomodulation represents potential new adjuvant therapies in infectious diseases such as tuberculosis. Major cytokines like TNFα exert a multifold role in host control of mycobacterial infections. GM-CSF and its receptor are over-expressed during acute M. tuberculosis infection and we asked how GM-CSF neutralization might affect host response, both in immunocompetent and in immunocompromised TNFα-deficient mice. GM-CSF neutralizing antibodies, at a dose effectively preventing acute lung inflammation, did not affect M. tuberculosis bacterial burden, but increased the number of granuloma in wild-type mice. We next assessed whether GM-CSF neutralization might affect the control of M. tuberculosis by isoniazid/rifampicin chemotherapy. GM-CSF neutralization compromised the bacterial control under sub-optimal isoniazid/rifampicin treatment in TNFα-deficient mice, leading to exacerbated lung inflammation with necrotic granulomatous structures and high numbers of intracellular M. tuberculosis bacilli. In vitro, GM-CSF neutralization promoted M2 anti-inflammatory phenotype in M. bovis BCG infected macrophages, with reduced mycobactericidal NO production and higher intracellular M. bovis BCG burden. Thus, GM-CSF pathway overexpression during acute M. tuberculosis infection contributes to an efficient M1 response, and interfering with GM-CSF pathway in the course of infection may impair the host inflammatory response against M. tuberculosis.


Conflict of interest statement

The authors declare no competing interests.

Figures

Figure 1
Figure 1
Increased pulmonary GM-CSF after acute airway inflammation and M. tuberculosis infection in vivo. WT mice were challenged intranasally with saline or LPS (1 µg/mouse) and GM-CSF levels in lung (A) and bronchoalveolar lavage (BAL) fluid (B) were measured after 24 h by ELISA. Pulmonary concentration of GM-CSF protein was measured 1 and 3 months (C) after in vivo M. tuberculosis infection (1000 ± 200 CFU/mouse i.n.) in WT mice, of after 1 month in WT and TNFα−/− mice (D). Data are representative of two independent experiments and are expressed as mean ± SEM (n = 5–8 mice per group). The expression of GM-CSF receptor β subunits genes Csf2rb1 (E) and of Csfrb2 (F) in the lungs 4 weeks post-M. tuberculosis infection in WT and in TNFα−/− mice was analyzed by microarray. Each group of infected mice has been statistically compared to the uninfected mice of the same phenotype. ****p < 0.0001, ***p < 0.001, **p < 0.01, *p < 0.05.
Figure 2
Figure 2
GM-CSF neutralization reduces inflammatory cell recruitment to the airways. WT mice were untreated or pre-treated with anti GM-CSF neutralizing antibody (Clone B2.6, 200 µg per mouse i.p.) 1 hour prior to LPS exposure (1 µg/mouse i.n.). Neutrophils (A), monocytes (B) and lymphocytes (C) recruitment were quantified in the BAL fluid after 24 h. The lung levels of CXCL1 (D), TNFα (E), IL-1β (F), Myeloperoxidase activity (G) and BAL levels of MMP9 (H) and TIMP1 (I) were measured. Lungs tissue was fixed in 4% buffered formaldehyde and HE staining is shown with a scoring of inflammatory cell recruitment and emphysema (J). Data are from two independent experiments (n = 4–9 mice per group) and are expressed as mean ± SEM. Statistical comparisons are presented between groups as indicated. ****p < 0.0001, **p < 0.01, *p < 0.05; ns, p > 0.05.
Figure 3
Figure 3
GM-CSF neutralization during M. tuberculosis infection. WT or TNFα−/− mice infected with M. tuberculosis H37Rv (1000 ± 200 CFU/mouse i.n.) received either GM-CSF neutralizing MAB (Clone A7.39, 200 µg per mouse i.p.) or IgG2b isotype control on day 14 and 21 post-infection and relative body weight gain was recorded (A,C). Bacterial burden was determined in the lungs on day 26 for TNFα−/− mice and on day 32 for WT mice (B,D). Data are from two independent experiments (n = 5–9 mice per group) and are expressed as mean values ± SEM. No statistical difference between the groups were observed (p > 0.05).
Figure 4
Figure 4
Effect of GM-CSF blockade on granuloma integrity and bacterial burden. WT (A) or TNFα−/− mice (B) infected with M. tuberculosis H37Rv received either GM-CSF neutralizing MAB or IgG2b isotype control on day 14 and 21 post-infection, as in Fig. 3. Lungs from infected mice were fixed, and HE (Left panels) and ZN (Middle panels) staining performed at day 26 for TNFα−/− mice and day 32 for WT mice post-infection. Black arrows point to acid-alcohol resistant bacilli. A scoring of cell infiltration and necrosis is shown (Right panels). The number of granuloma per mm² and surface of granulomatous lesions (expressed as %) were quantified on digitalized sections. Data are expressed as mean ± SEM. (n = 4–5 mice per group). Statistically significant comparisons are presented. *p < 0.05.
Figure 5
Figure 5
GM-CSF neutralization during treatment of M. tuberculosis infection by sub-optimal chemotherapy. WT and TNFα−/− mice were infected with M. tuberculosis H37Rv (1000 ± 200 CFU/mouse i.n.) and untreated or treated with increasing doses of antibiotics (INH/RIF) in drinking water from day 14 to day 35 post-infection, as indicated. Relative body weight gain was recorded (A) and lung bacterial burden was measured on day 26, 32 and 78 post-infection for antibiotics doses of 1, 10 and 100 mg/L, respectively (B). Anti GM-CSF antibody (Clone A7.39, 200 µg per mouse i.p.) or IgG2b isotype control was combined with chemotherapy during M. tuberculosis infection. INH/RIF were administered from day 14 to day 32 post-infection and anti GM-CSF MAB administered once a week for two weeks, on day 14 and day 21 post-infection (C). The relative bodyweight (D) and lung bacterial burden were measured after INH/RIF 10 mg/L (E) treatments. The lung levels of IL-12p40 (F) and IFNγ (G) were measured by ELISA at day 26 post-infection after INH/RIF 10 mg/L treatment. Data expressed as mean values ± SEM (n = 4–6 mice per group). Statistical comparisons are presented as compared to isotype control treated mice, unless otherwise indicated (B). ****p < 0.0001, ***p < 0.001, *p < 0.05, ns, p > 0.05.
Figure 6
Figure 6
Effect of GM-CSF blockade combined with sub-optimal chemotherapy on granuloma integrity and lung bacterial burden. TNFα−/− mice were infected with M. tuberculosis H37Rv (1000 ± 200 CFU/mouse i.n.), treated or not with 10 mg/L of antibiotics (INH/RIF) in drinking water from day 14 to day 32 post-infection and GM-CSF was neutralized by anti GM-CSF MAB, as indicated in Fig. 5C. On day 32 post-infection, lungs from infected mice were fixed, and stained for HE (A) or ZN (B). A scoring of cell infiltration and necrosis is shown, together with the surface of granulomatous lesions, free alveolar space, number of M. tuberculosis (M. tb) clusters per mm² and number of bacilli per cluster were quantified on digitalized sections (C). Blacks arrows points to acid-alcohol resistant bacilli. Data are expressed as mean ± SEM (n = 4–6 mice per group). Statistical comparisons are presented as compared to isotype control treated mice. **p < 0.01.
Figure 7
Figure 7
In vitro GM-CSF neutralization induces a switch towards M2 macrophage polarization profile after mycobacterial infection. Mannose receptor CD206 expression was determined by flow cytometry in macrophages treated with GM-CSF neutralizing MAB (Clone A7.39) or IgG2b isotype control (1 µg/mL) and either unstimulated (medium), or stimulated with M. bovis BCG (M.O.I.:2) or LPS (100 ng/mL) during 24 hours. CD11b+ cells were pre-gated and F4/80+CD206+ double positive cells were selected, as shown on representative dot blots (A), together with cell frequency (B). Histograms (C) and MFI (D) of BMDMs treated with anti GM-CSF MAB (blue lines) or IgG2b isotype control (red lines) and labeled with rat anti-mouse CD206-APC (clone MR5D3) antibodies are shown, as compared to isotype control (grey). Data are expressed as mean ± SD of n = 2 independent cultures. M1 and M2-related genes expression was measured in macrophages after 24 hours of stimulation. The mRNA levels of nitric oxide synthase 2 (Nos2, E), arginase 1 (Arg1, F), chitinase-like 3 (Ym1, G), CD206 mannose receptor, C type 1 (Mrc1, H) and suppressor of cytokine signaling 3 (Socs3, I) were analyzed by RT-qPCR. The fold change of mRNA levels, normalized to Gapdh level in medium, is shown. Data are from two independent experiments and are expressed as mean values ± SEM of n = 4 independent cultures. Statistical comparisons are presented as compared to isotype control treated cells. ****p < 0.0001, **p < 0.01, *p < 0.05.
Figure 8
Figure 8
In vitro GM-CSF blockade is deleterious for nitric oxide production and mycobacterial killing. Macrophages treated with GM-CSF neutralizing MAB (Clone A7.39) or IgG2b isotype control (1 µg/mL) were either unstimulated (medium), or infected with M. bovis BCG-GFP (MOI:4) during 24 hours. After 24 hours, NO production was quantified in cell supernatant using Griess reaction (A) and TNFα (B), IL12p40 (C) and IL-10 (D) levels were quantified by ELISA. Infected macrophages were also fixed in paraformaldehyde 4% during 10 minutes and mounted on slides using Fluoromount® (E). Cells were observed in confocal microscopy at 63x magnitude. A quantification of GFP+ M. bovis BCG per cell is shown (F). Six additional fields with individual cells infected with BCG-GFP in the presence of anti GM-CSF MAB or isotype control are shown (G). Data are expressed as mean ± SD of n = 2 independent cultures (AD) or n = 26–32 individual cells (F). Statistical comparisons are presented as compared to non-infected cells or in between groups treated with GM-CSF neutralizing MAB, as indicated. ****p < 0.0001, ND, Not Detected.

References

    1. Dheda K, et al. Global control of tuberculosis: from extensively drug-resistant to untreatable tuberculosis. The Lancet. Respiratory medicine. 2014;2:321–338. doi: 10.1016/S2213-2600(14)70031-1. - DOI - PMC - PubMed
    1. Singhal, A. et al. Metformin as adjunct antituberculosis therapy. Science translational medicine6, 263ra159, 10.1126/scitranslmed.3009885 (2014). - PubMed
    1. Zumla A, et al. Host-directed therapies for infectious diseases: current status, recent progress, and future prospects. The Lancet. Infectious diseases. 2016;16:e47–63. doi: 10.1016/S1473-3099(16)00078-5. - DOI - PMC - PubMed
    1. O’Connor G, et al. Sharpening nature’s tools for efficient tuberculosis control: A review of the potential role and development of host-directed therapies and strategies for targeted respiratory delivery. Advanced drug delivery reviews. 2016;102:33–54. doi: 10.1016/j.addr.2016.04.024. - DOI - PubMed
    1. Yang Z, et al. How dormant is Mycobacterium tuberculosis during latency? A study integrating genomics and molecular epidemiology. Infection, genetics and evolution: journal of molecular epidemiology and evolutionary genetics in infectious diseases. 2011;11:1164–1167. doi: 10.1016/j.meegid.2011.02.002. - DOI - PMC - PubMed

Publication types

MeSH terms

LinkOut - more resources