. 2018 May 22:9:431.
doi: 10.3389/fphar.2018.00431. eCollection 2018.

GPCRomics: GPCR Expression in Cancer Cells and Tumors Identifies New, Potential Biomarkers and Therapeutic Targets

Affiliations

GPCRomics: GPCR Expression in Cancer Cells and Tumors Identifies New, Potential Biomarkers and Therapeutic Targets

Paul A Insel et al. Front Pharmacol. .

Abstract

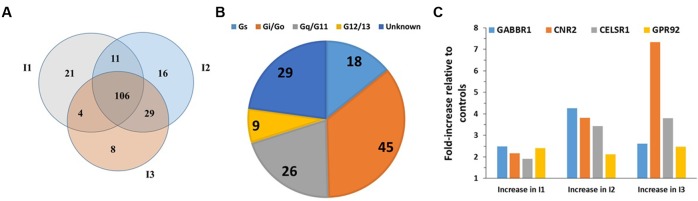
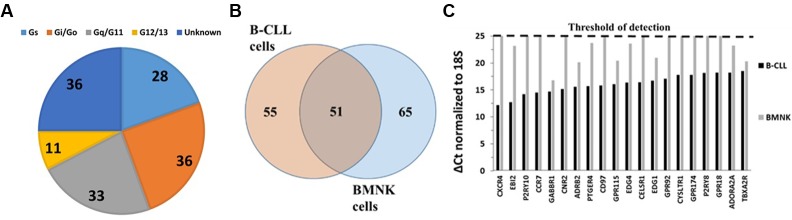
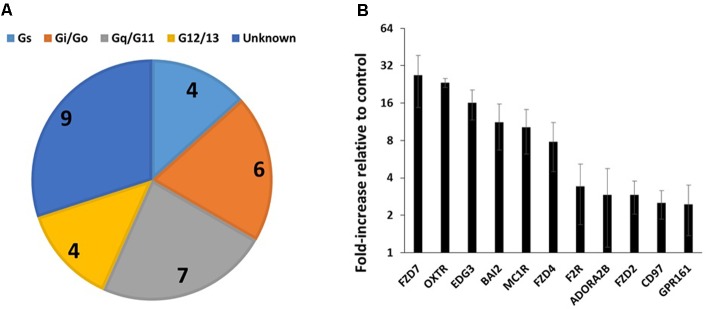
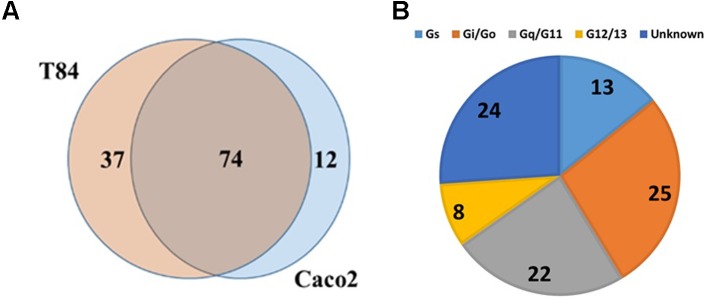
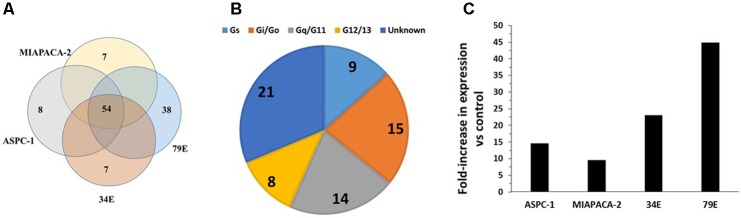
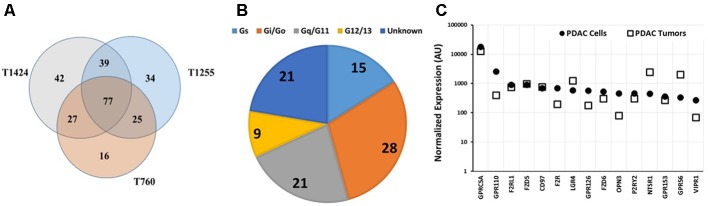
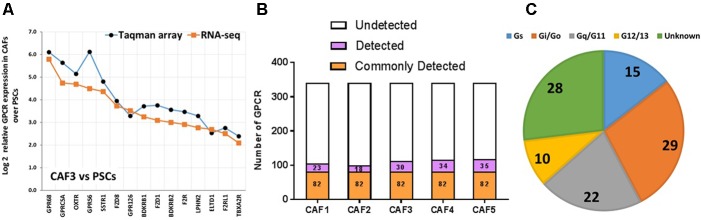
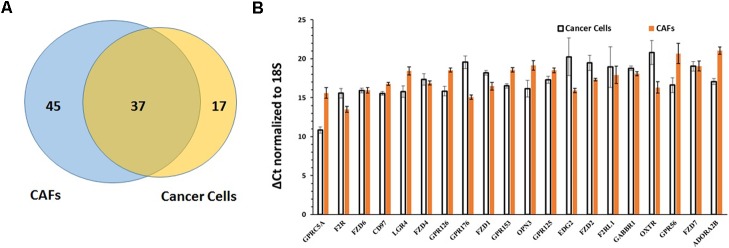
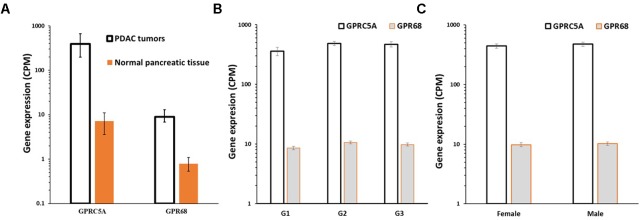
G protein-coupled receptors (GPCRs), the largest family of targets for approved drugs, are rarely targeted for cancer treatment, except for certain endocrine and hormone-responsive tumors. Limited knowledge regarding GPCR expression in cancer cells likely has contributed to this lack of use of GPCR-targeted drugs as cancer therapeutics. We thus undertook GPCRomic studies to define the expression of endoGPCRs (which respond to endogenous molecules such as hormones, neurotransmitters and metabolites) in multiple types of cancer cells. Using TaqMan qPCR arrays to quantify the mRNA expression of ∼340 such GPCRs, we found that human chronic lymphocytic leukemia (CLL) cells/stromal cells associated with CLL, breast cancer cell lines, colon cancer cell lines, pancreatic ductal adenocarcinoma (PDAC) cells, cancer associated fibroblasts (CAFs), and PDAC tumors express 50 to >100 GPCRs, including many orphan GPCRs (which lack known physiologic agonists). Limited prior data exist regarding the expression or function of most of the highly expressed GPCRs in these cancer cells and tumors. Independent results from public cancer gene expression databases confirm the expression of such GPCRs. We propose that highly expressed GPCRs in cancer cells (for example, GPRC5A in PDAC and colon cancer cells and GPR68 in PDAC CAFs) may contribute to the malignant phenotype, serve as biomarkers and/or may be novel therapeutic targets for the treatment of cancer.

Keywords: GPCR array; breast cancer; cancer microenvironment; chronic lymphocytic leukemia; colon cancer; orphan receptors; pancreatic cancer.


Figures

FIGURE 1
FIGURE 1
GPCR expression in B-CLL cells. (A) Venn diagram showing the number of GPCRs expressed in B-CLL cells (I1, I2, and I3) isolated from three different patients with indolent CLL. I1, I2, and I3, expressed 142, 162, and 147 GPCRs, respectively, and shared in expression of 106 GPCRs. (B) G protein linkages of the 106 commonly expressed GPCRs. (C) The expression (ΔCt normalized to 18S rRNA) and fold-increase in expression in indolent CLL cells compared to control B cells of the four GPCRs (GABBR1, CNR2, CELSR1, and GPR92) with approximately twofold (or greater) increases in expression in the CLL cells. n = 3 biological replicates of B-CLL, analyzed on one array each.
FIGURE 2
FIGURE 2
GPCR expression in BMNK cells. (A) G protein linkages of the 116 GPCRs detected in BMNK cells. (B) Venn diagram of GPCRs expressed in B-CLL compared to BMNK cells, indicating that 51 GPCRs are shared but most receptors are unique for each cell-type. (C) Lower expression in the BMNK cells (higher ΔCt values) for most of the highest expressed GPCRs in B-CLL cells (lower ΔCt values). n = 1 for each cell type.
FIGURE 3
FIGURE 3
GPCR expression in triple-negative breast cancer cells. (A) G protein linkages of the 23 commonly detected GPCRs in four breast cancer cell lines. (B) Average (and SEM) of the fold-increases in expression of GPCRs in triple-negative breast cancer cells compared to control cells. Of the 23 commonly detected GPCRs, the 11 shown have a greater than twofold average increase in expression. n = 4 cell lines, assayed on one array each.
FIGURE 4
FIGURE 4
GPCR expression in colon cancer cells. (A) Venn diagram showing GPCRs expressed in two colon cancer cell lines, Caco-2 and T84 with 74 GPCRs commonly detected between the two cell lines. (B) G protein linkage of the 74 commonly detected GPCRs. n = 2 cell lines, assayed on one array each.
FIGURE 5
FIGURE 5
GPCR expression in pancreatic ductal adenocarcinoma (PDAC) cells. (A) Venn diagram showing GPCRs expressed in two PDAC cell lines (MiaPaCa, AsPC-1) and primary PDAC cells (34E, 79E); 54 GPCRs were detected in all four samples. The number of GPCRs in each cell-line was: MiaPaCa-2: 92, AsPC-1: 114, 79E: 175, 34E: 130. (B) G protein linkage of the 54 commonly detected GPCRs. (C) Fold-increase in GPRC5A expression in PDAC cells compared to the control pancreatic ductal epithelial cells (PDEC). n = 4 cell lines, each assayed on one array each.
FIGURE 6
FIGURE 6
GPCR expression in pancreatic cancer tumors. (A) Venn diagram of GPCR expression, determined using Taqman GPCR arrays, of three PDAC tumor samples with 77 GPCRs commonly detected among the samples. T1424, T1255, and T760 expressed 185, 175, and 145 GPCRs, respectively. (B) G-protein linkage of the 77 commonly detected GPCRs. (C) GPRC5A is expressed at similar levels in PDAC cells and tumors. The highest expressed GPCRs in cancer cells were also highly expressed in tumors. n = 3 primary tumors, each assayed on one array each.
FIGURE 7
FIGURE 7
GPCR expression in CAFs. (A) Increase in expression, as determined by Taqman GPCR arrays or RNA-seq in one CAF sample (CAF3) compared to pancreatic stellate cells (PSCs) of the 15 GPCRs with the largest increases in expression in CAFs compared to PSCs. (B) CAFs express ∼110 GPCRs, with 82 receptors commonly detected in five patient replicates tested. (C) G protein linkage of the 82 commonly detected GPCRs. Five separate CAF biological replicates were analyzed via Taqman arrays, while three of these were also analyzed via RNA-seq.
FIGURE 8
FIGURE 8
Comparison of GPCR expression in PDAC cells and CAFs. (A) PDAC cells and CAFs share in expression of 37 GPCRs. (B) The 20 GPCRs shared in expression by PDAC cells and CAFs and with the highest expression in PDAC cells and CAFs, determined by averaging GPCR expression in the two cell types. Mean and SEM are indicated for ΔCt values (normalized to 18S rRNA). Lower Δ Ct values indicate higher expression.
FIGURE 9
FIGURE 9
GPRC5A and GPR68 are highly expressed in PDAC tumors. (A) Median, upper and lower quartile expression values (indicated by the error bars) for GPRC5A and GPR68 in PDAC tumors (TCGA, n = 147) and in normal pancreatic tissue (GTEx, n = 165). In PDAC tumors, GPRC5A is increased ∼50-fold (FDR << 0.05) and GPR68 is increased ∼10-fold (FDR << 0.05). (B) Mean (and SEM) expression of GPRC5A and GPR68 in PDAC tumors (in TCGA) with tumor grades G1, G2, and G3. (C) Mean (and SEM) expression of GPRC5A and GPR68 in TCGA PDAC tumors from males and females. Expression differences for tumor grades and between males and females are not statistically significant.
FIGURE 10
FIGURE 10
GPRC5A antibody staining in PDAC cells. (A) BXPC-3 (B) MIA PaCa-2. Using RNA-seq and qPCR, MIA PaCa-2 cells express >10-fold more GPRC5A mRNA than do BXPC-3 cells. Hence, MIA PaCa-2 cells stain more intensely for GPRC5A. Magnification = 10×. Images are representative of data for n = 3 separate slides for each cell line, respectively.

References

    1. Alexander S. P., Kelly E., Marrion N. V., Peters J. A., Faccenda E., Harding S. D., et al. (2017). The Concise Guide to PHARMACOLOGY 2017/18: Overview. 174(Suppl. 1), S1–S16. 10.1111/bph.13882 - DOI - PMC - PubMed
    1. Alsaab H. O., Sau S., Alzhrani R., Tatiparti K., Bhise K., Kashaw S. K., et al. (2017). PD-1 and PD-L1 checkpoint signaling inhibition for cancer immunotherapy: mechanism, combinations, and clinical outcome. 8:561. 10.3389/fphar.2017.00561 - DOI - PMC - PubMed
    1. Amisten S., Neville M., Hawkes R., Persaud S. J., Karpe F., Salehi A. (2015). An atlas of G-protein coupled receptor expression and function in human subcutaneous adipose tissue. 146 61–93. 10.1016/j.pharmthera.2014.09.007 - DOI - PubMed
    1. Atkins M. B., Larkin J. (2016). Immunotherapy combined or sequenced with targeted therapy in the treatment of solid tumors: current perspectives. 108:djv414. 10.1093/jnci/djv414 - DOI - PubMed
    1. Barretina J., Caponigro G., Stransky N., Venkatesan K., Margolin A. A., Kim S., et al. (2012). The Cancer Cell Line Encyclopedia enables predictive modelling of anticancer drug sensitivity. 483 603–607. 10.1038/nature11003 - DOI - PMC - PubMed