. 2018 May 28:4:18.
doi: 10.1038/s41540-018-0060-5. eCollection 2018.

Pathway crosstalk enables cells to interpret TGF-β duration

Affiliations

Pathway crosstalk enables cells to interpret TGF-β duration

Jingyu Zhang et al. NPJ Syst Biol Appl. .

Abstract

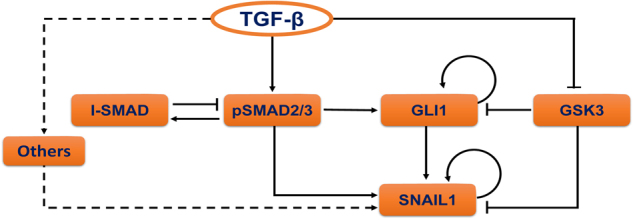
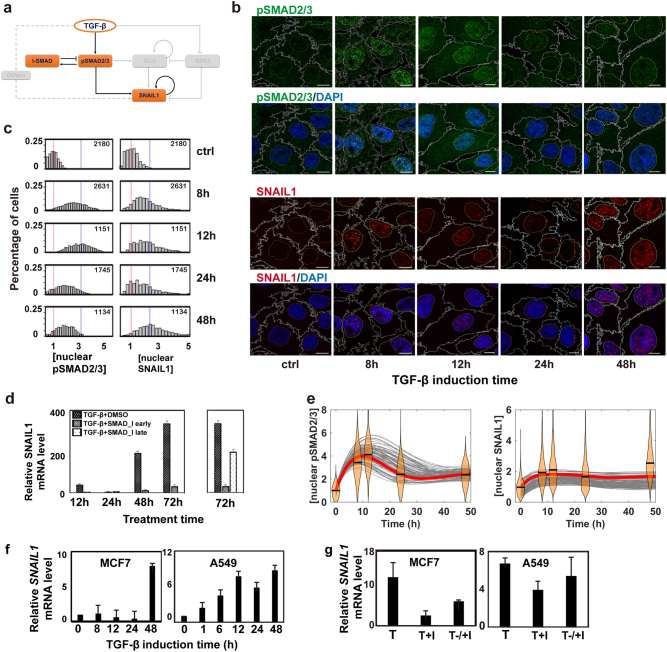
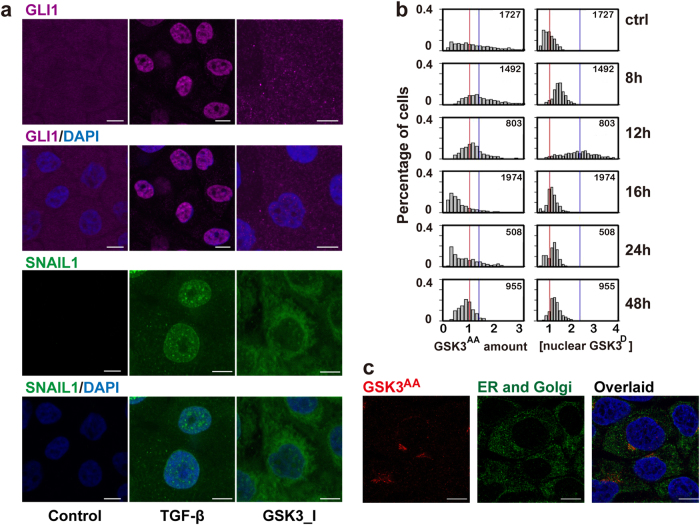
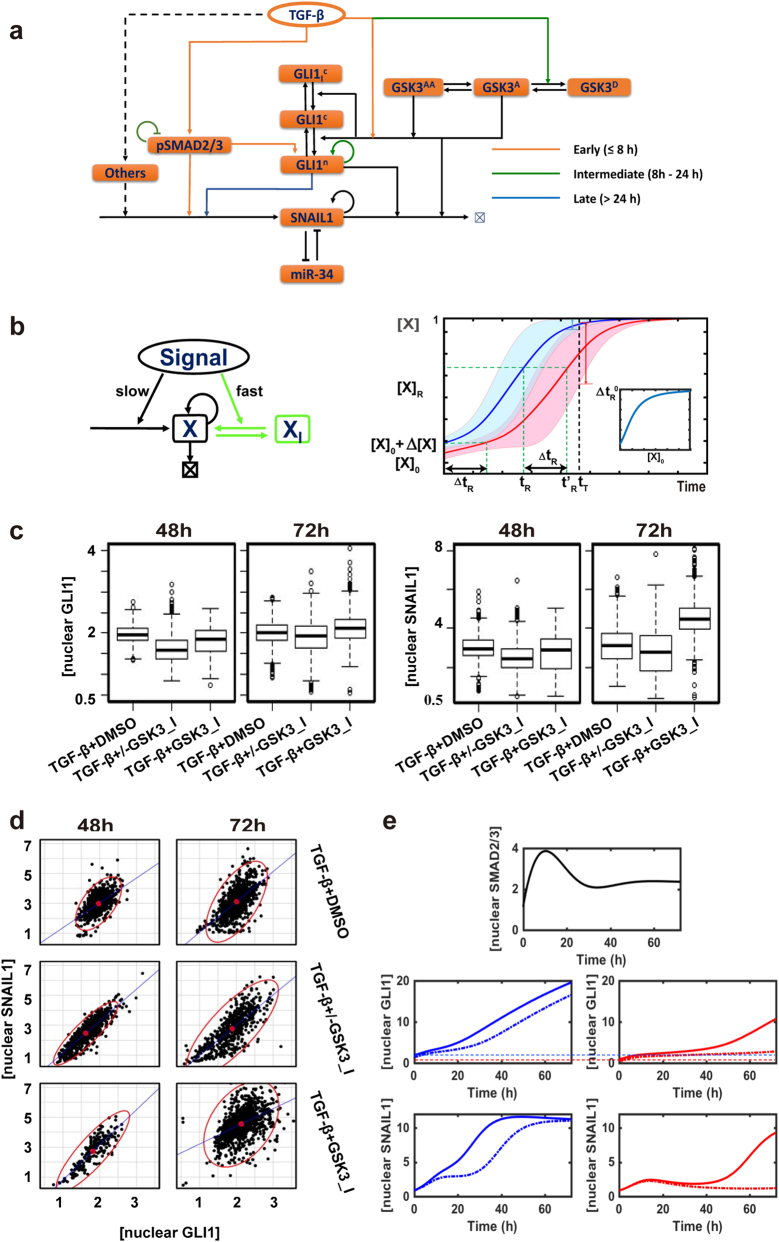
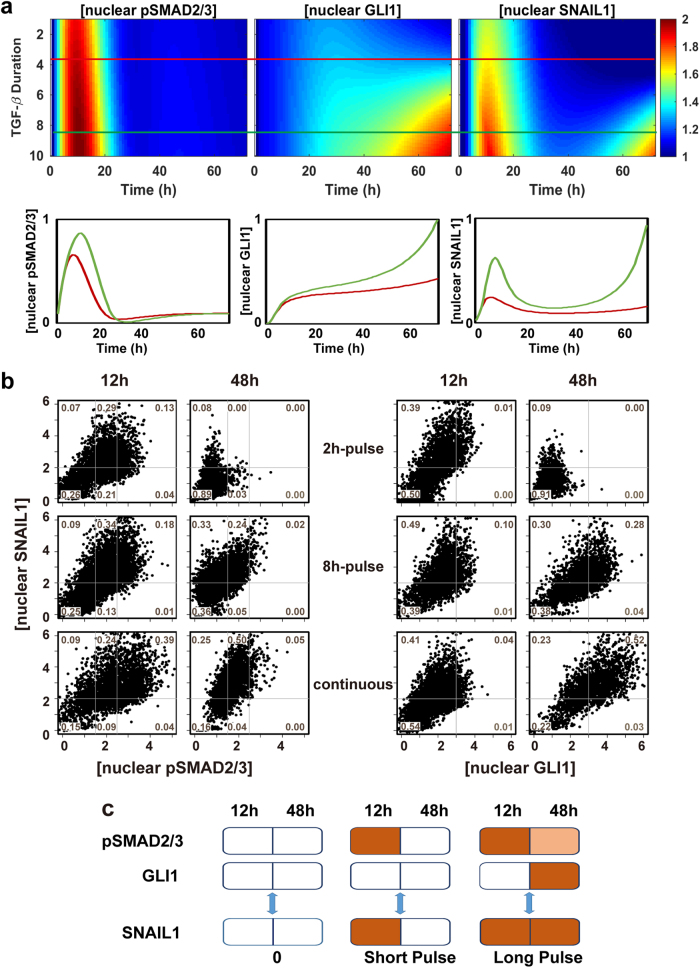
The detection and transmission of the temporal quality of intracellular and extracellular signals is an essential cellular mechanism. It remains largely unexplored how cells interpret the duration information of a stimulus. In this paper, we performed an integrated quantitative and computational analysis on TGF-β induced activation of SNAIL1, a key transcription factor that regulates several subsequent cell fate decisions such as apoptosis and epithelial-to-mesenchymal transition. We demonstrate that crosstalk among multiple TGF-β activated pathways forms a relay from SMAD to GLI1 that initializes and maintains SNAILl expression, respectively. SNAIL1 functions as a key integrator of information from TGF-β signaling distributed through upstream divergent pathways. The intertwined network serves as a temporal checkpoint, so that cells can generate a transient or sustained expression of SNAIL1 depending on TGF-β duration. Furthermore, we observed that TGF-β treatment leads to an unexpected accumulation of GSK3 molecules in an enzymatically active tyrosine phosphorylation form in Golgi apparatus and ER, followed by accumulation of GSK3 molecules in an enzymatically inhibitive serine phosphorylation in the nucleus. Subsequent model analysis and inhibition experiments revealed that the initial localized increase of GSK3 enzymatic activity couples to the positive feedback loop of the substrate Gli1 to form a network motif with multi-objective functions. That is, the motif is robust against stochastic fluctuations, and has a narrow distribution of response time that is insensitive to initial conditions. Specifically for TGF-β signaling, the motif ensures a smooth relay from SMAD to GLI1 on regulating SNAIL1 expression.


Conflict of interest statement

The authors declare no competing interests.

Figures

Fig. 1
Fig. 1
TGF-β induced signaling crosstalk network converges to SNAIL1. Reconstructed literature-based pathway crosstalk for TGF-β induced SNAIL1 expression. The node “others” refer remaining SNAIL1 activation pathways that have minor contributions to the time window under study and thus are not explicitly treated
Fig. 2
Fig. 2
The SMAD proteins induce the first wave of SNAIL1. a Canonical SMAD-dependent pathway for TGF-β activation of SNAIL1 highlighted from the network in Fig. 1. b Two-color immunofluorescence (IF) images of pSMAD2/3 and SNAIL1 of MCF10A cells induced by 4 ng/ml TGF-β1 at various time points. The scale bar is 10 μm and is the same for other IF images in this paper. c Distributions of nuclear pSMAD2/3 and SNAIL1 concentrations quantified from the IF images. Red vertical lines indicate the mean value of the distributions at time 0, and blue vertical lines represent that at 12 h (for pSMAD2/3) or at 48 h (for SNAIL1), respectively. The number marked in each figure panel is the number of randomly selected cells used for the analysis. Throughout the paper we report fold changes of concentration and amount relative to the mean basal value of the corresponding quantity. d Effects of early (added together with TGF-β) and late (48 h after adding TGF-β) pSMAD inhibition on the SNAIL1 mRNA level in MCF10A cells. e Thorough parameter space search confirmed that with the model in panel a one can fit the pSMAD2/3 dynamics, but not the two-wave SNAIL1 dynamics. The experimental data are shown as violin plots with the medians given by black bars. Solid curves are computational results with parameter sets sampled from the Monte Carlo search, and the red curves are the best-fit results. f Fold change of SNAIL1 mRNA levels in MCF7 and A549 cells measured with quantitative RT-PCR after TGF-β1 treatment. g Fold change of SNAIL1 mRNA levels measured with quantitative RT-PCR at 72 h after TGF-β1 (T) treatment. For early inhibition (T + I) the inhibitor was added at the time of starting TGF-β1 treatment. For late inhibition (T−/+I) the inhibitor was added 48 h (for MCF7) and 24 h (for A549) after starting TGF-β1 treatment, respectively. The inhibition results were compared to the TGF-β treatment (T) result at the same time point
Fig. 3
Fig. 3
GLI1 is a major contributor to activate the second wave of SNAIL1 expression. a TGF-β activates the GLI1/SNAIL1 module partly through pSMAD2/3. b IF images on protein levels of GLI1 (in the free form). Red and blue vertical lines indicate the mean values of the distributions at time 0 and at 48 h, respectively. c Distributions of nuclear GLI1 concentrations quantified from the IF images. d Experimental validation of the results for early (added together with TGF-β) GLI1 inhibition on the SNAIL1 mRNA level in MCF10A cells. e Experimental validation of the results for late (48 h after adding TGF-β) GLI1 inhibition on the SNAIL1 mRNA level in MCF10A cells. f Fold change of GLI1 mRNA levels measured with quantitative RT-PCR at different time points after combined TGF-β1 treatment in MCF7 or A549 cells. g Fold change of SNAIL1 mRNA levels measured with quantitative RT-PCR at 72 h after combined TGF-β1 and GLI1 inhibitor GANT61 treatment in MCF7 or A549 cells. For early inhibition (T + I) the inhibitor was added at the time of starting TGF-β1 treatment. For late inhibition (T−/+I) the inhibitor was added 48 h (for MCF7) and 24 h (for A549) after starting TGF-β1 treatment, respectively. TGF-β treatment group (T) is shown as a positive control
Fig. 4
Fig. 4
TGF-β induced temporal switch between active and inhibitive phosphorylation forms of GSK3 proteins. a IF images showed that inhibiting GSK3 enzymatic activity alone increased SNAIL1 accumulation but did not recapitulate TGF-β induced GLI1 nuclear translocation. b Quantification of the IF images of MCF10A cells at different time points after TGF-β treatment. Red vertical lines indicate the mean value of the distributions at time 0, and blue vertical lines represent that at 8 h (for GSK3AA) or at 12 h (for GSK3D), respectively. c IF images showing GSK3AA localization at the endoplasmic reticulum center (ERC)
Fig. 5
Fig. 5
The GSK3 phosphorylation switch smoothens the SMAD-GLI1 relay. a Proposed expanded network for TGF-β induced SNAIL1 expression. b Left: Schematic of a generic positive feedback loop network. Also shown in green is an additional reservoir of the molecules in inactive form (XI) that can convert quickly into the active form (X) upon stimulation. Right: The response time tR is sensitive to the initial concentration, (X)0 vs. (X)0 + Δ(X)0. The inlet figure shows the dependence of ΔtR on (X)0 with Δ(X)0 fixed. c Box plots of GSK3 inhibition experimental data. d Scattered plots of GSK3 inhibition experimental data. Red points are the center of the scattered plots and each ellipse encloses 97.5% of the data points. Both were drawn with the R package, car::data.ellipse. e Computational simulation of SMAD, SNAIL1 and GLI1 behavior with (solid line) or without (dotted line) initial boosting in cells with high basal GLI1 level (left panels) or low basal GLI1 (right panels)
Fig. 6
Fig. 6
The TGF-β-SNAIL1 network permits detection of TGF-β duration and differential responses. a Model predictions that the network generates one or two waves of SNAIL1 depending on TGF-β duration. The red line overlaid on the heatmap is a sampling time of the short-time TGF-β induction. The green line represents the long-time TGF-β treatment. b Single cell protein concentrations quantified from IF images of cells under pulsed and continuous TGF-β treatments. The solid lines divide the space into coarse-grained states with respect to the corresponding mean values without TGF-β treatments (=1). c Schematics of how cells encode information of TGF-β duration through a temporally ordered state space

Similar articles

Cited by

References

    1. Albeck JG, Mills GB, Brugge JS. Frequency-modulated pulses of ERK activity transmit quantitative proliferation signals. Mol. Cell. 2013;49:249–261. doi: 10.1016/j.molcel.2012.11.002. - DOI - PMC - PubMed
    1. English JG, et al. MAPK feedback encodes a switch and timer for tunable stress adaptation in yeast. Sci. Signal. 2015;8:ra5. doi: 10.1126/scisignal.2005774. - DOI - PMC - PubMed
    1. Fu Y, et al. Reciprocal encoding of signal intensity and duration in a glucose-sensing circuit. Cell. 2014;156:1084–1095. doi: 10.1016/j.cell.2014.01.013. - DOI - PMC - PubMed
    1. Kholodenko BN. Cell-signalling dynamics in time and space. Nat. Rev. Mol. Cell Biol. 2006;7:165–176. doi: 10.1038/nrm1838. - DOI - PMC - PubMed
    1. Behar M, Hoffmann A. Understanding the temporal codes of intra-cellular signals. Curr. Opin. Genet. Dev. 2010;20:684–693. doi: 10.1016/j.gde.2010.09.007. - DOI - PMC - PubMed