. 2018 Aug 1;58(2):174-185.
doi: 10.1093/icb/icy050.

Can Strain Dependent Inhibition of Cross-Bridge Binding Explain Shifts in Optimum Muscle Length?

Affiliations

Can Strain Dependent Inhibition of Cross-Bridge Binding Explain Shifts in Optimum Muscle Length?

N C Holt et al. Integr Comp Biol. .

Abstract

Skeletal muscle force is generated by cross-bridge interactions between the overlapping contractile proteins, actin and myosin. The geometry of this overlap gives us the force-length relationship in which maximum isometric force is generated at an intermediate, optimum, length. However, the force-length relationship is not constant; optimum length increases with decreasing muscle activation. This effect is not predicted from actin-myosin overlap. Here we present evidence that this activation-dependent shift in optimum length may be due to a series compliance within muscles. As muscles generate force during fixed-end contractions, fibers shorten against series compliance until forces equilibrate and they become isometric. Shortening against series-compliance is proportional to activation, and creates conditions under which shortening-induced force depression may suppress full force development. Greater shortening will result in greater force depression. Hence, optimum length may decrease as activation rises due to greater fiber shortening. We discuss explanations of such history dependence, giving a review of previously proposed processes and suggesting a novel mechanistic explanation for the most likely candidate process based on tropomyosin kinetics. We suggest this mechanism could change the relationship between actin-myosin overlap and cross-bridge binding potential, not only depressing force at any given length, but also altering the relationship between force and length. This would have major consequences for our understanding of in vivo muscle performance.


Figures

Fig. 1
Fig. 1
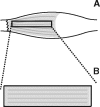
Sample force (A) and fiber length traces (B) for maximum (solid), and ∼40% activation (dotted), conditions. Force and fiber length values are determined as indicated. The schematic in B indicates the fiber lengths during the fixed-end contraction. Muscle fibers (gray) shortened against the compliant aponeurosis (white) and Lfiber was taken as the final length at which isometry was reached. This shortening is proportional to the muscle activation and force produced (A, B). The force and length values determined were plotted against one another (circles) for multiple fixed-end contractions under maximum (solid), ∼70% (dashed), and ∼40% (dotted) activation conditions, and a third-order polynomial fitted to each data set (C). F0 and L0fiber were then determined for each activation condition.
Fig. 2
Fig. 2
Results from the reanalysis of Holt and Azizi (2014). Sample force (A) and muscle length traces (B) for maximum (solid) and ∼40% activation (dotted) conditions. Force was determined as in Fig. 1 and muscle length was taken as the constant length shown in B. The schematic in B indicates how length is determined in this reanalysis compared with the original analysis (Fig. 1B). Length was taken as total muscle length. The force and length values determined were plotted against one another (circles) for multiple fixed-end contractions for maximum (solid), ∼70% (dashed), and ∼40% (dotted) activation conditions, and a third-order polynomial fitted to each data set (C). F0 and L0muscle were then determined. It should be noted that this is the same data as in Fig. 1, simply with length calculated as the muscle length (B) rather than the post-shortening fiber length (Fig. 1B).
Fig. 3
Fig. 3
Summary L0fiber (solid bars) (data from Fig. 1) and L0muscle (open bars) (data from Fig. 2) optimum length data for all activation conditions. There is a significant effect of activation condition on optimum fiber length (P < 0.001; lme), but not on optimum muscle length (P = 0.065; lme). Hence, we suggest that the length at which fibers started a contraction (muscle length) at remained relatively constant across activation conditions, but that the increasing fiber shortening with increasing activation drove the observed decrease in the optimum fiber lengths.
Fig. 4
Fig. 4
Schematic representation of high- (A) and low- (B) compliance conditions. The high-compliance condition is the intact bullfrog plantaris muscle in which fibers (gray) operate in series with a large, compliant aponeurosis (white). Fibers shorten, stretching the aponeurosis on activation. The low-compliance condition is fibers extracted from the bullfrog plantaris muscle. Fibers operate isolated from the compliant aponeurosis, and hence do not shorten upon activation.
Fig. 5
Fig. 5
Sample force (A) and length traces (B) for high (solid) and low (dashed) activation conditions with high compliance. Force and length values were determined as previously (Fig. 1). The large fiber shortening reflects the high series compliance. These force–length points from multiple contractions were plotted against one another, and a third-order polynomials fitted to each data set (C). F0 and L0 were then determined.
Fig. 6
Fig. 6
Sample force (A) and fiber length traces (B) for high (solid) and low (dashed) activation conditions with low compliance. Low compliance is reflected in the lack of fiber shortening (B). Force–length points from multiple contractions are plotted against one another, and a third-order polynomial fitted to each data set (C). F0 and L0 were then determined.
Fig. 7
Fig. 7
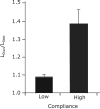
Summary data showing the activation-dependent shift (L0twi/L0tet) with high (data from Fig. 5) and low (data from Fig. 6) compliance. There was a significant interactive effect of activation and compliance on the activation-dependent shift (P = 0.025; lme), indicating that the shift increased with increasing compliance.
Fig. 8
Fig. 8
Example of force depression induced shifts in location along the force–length curve due to the interaction of MTU series compliance and varying levels of activation. In the schematics the tendon is shown as a dark gray spring, the thick filament and myosin in red (mid-gray), the thin filament in blue (light gray), and the areas of initial and new overlap in green (pale gray) and red (dark grey), respectively. (A) Under high activation the contractile element of a MTU shortens from IH to FH due to series compliance, increasing the thick–thin overlap. The motors in this region have a decreased chance of forming new cross-bridges due to force depression. (B) The same MTU, at a different initial length, is subjected to low levels of activation that result in the contractile element shortening from IL to FL where the final length is the same as in panel A (FL=FL). As less force was generated by lower levels of activation to reach this final CE length, there is less region of new overlap and thus fewer motors inhibited from forming new cross-bridges by force depression. Despite having identical final MTU lengths, the two cases have different effective overlaps (ϵH or ϵL), the fractions of the thick and thin filaments able to interact and generate force. This places the two cases at different effective points on the force–length curve, shifting the force–length curve in an activation dependent fashion for muscle subject to the series compliance found in the MTU.

References

    1. Abbott BC, Aubert XM.. 1952a. Changes of energy in a muscle during very slow stretches. J Physiol 117:104–17. - PubMed
    1. Abbott BC, Aubert XM.. 1952b. The force exerted by active striated muscle during and after change of length. J Physiol 117:77–86. - PMC - PubMed
    1. Adrian E, Bronk DW.. 1929. The discharge of impulses in motor nerve fibers. Part II. The frequency of discharge in reflex and voluntary contractions. J Physiol 67:9–151. - PMC - PubMed
    1. Arnold EM, Hamner SR, Seth A, Millard M, Delp SL.. 2013. How muscle fiber lengths and velocities affect muscle force generation as humans walk and run at different speeds. J Exp Biol 216:2150–60. - PMC - PubMed
    1. Azizi E. 2014. Locomotor function shapes the passive mechanical properties and operating lengths of muscle. Proc R Soc B 281:20132914. - PMC - PubMed

Publication types