. 2018 Jul 6;46(12):6188-6205.
doi: 10.1093/nar/gky455.

Identification of a novel TIF-IA-NF-κB nucleolar stress response pathway

Affiliations

Identification of a novel TIF-IA-NF-κB nucleolar stress response pathway

Jingyu Chen et al. Nucleic Acids Res. .

Abstract

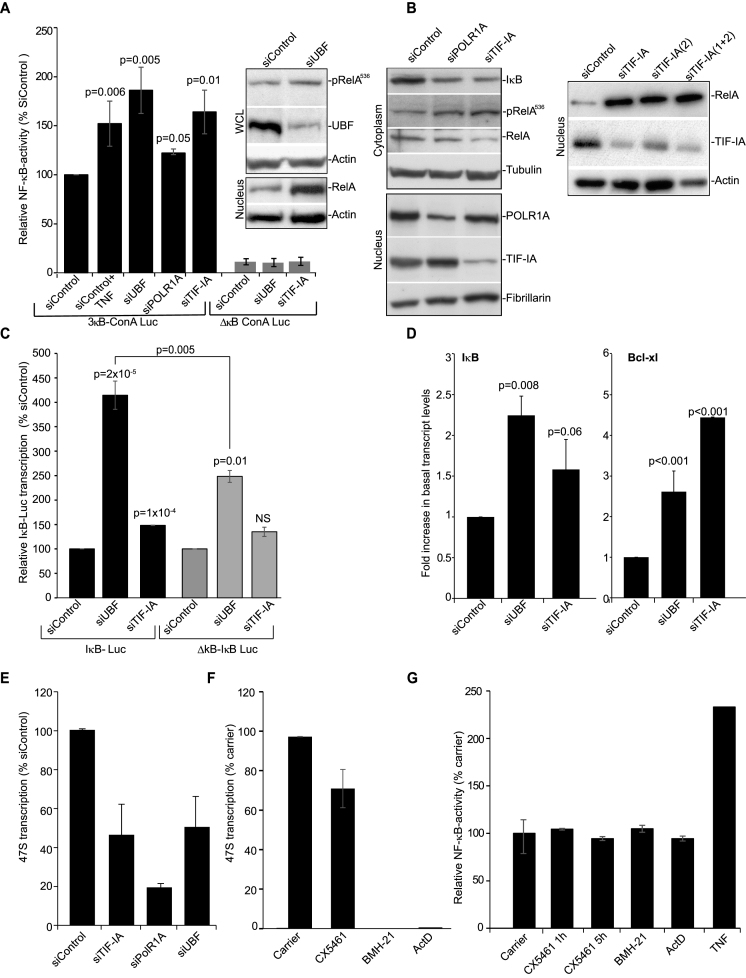
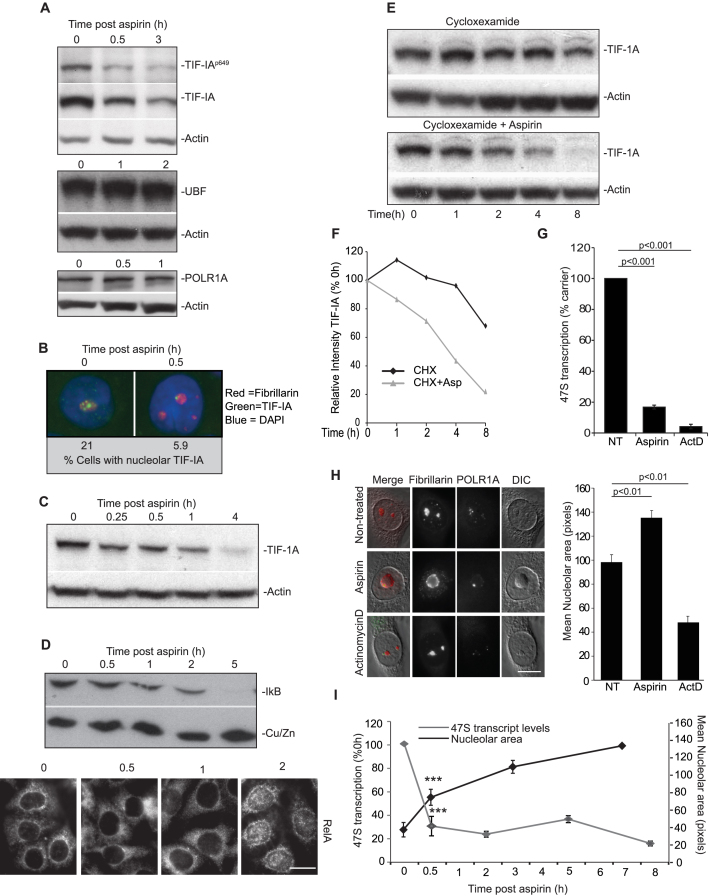
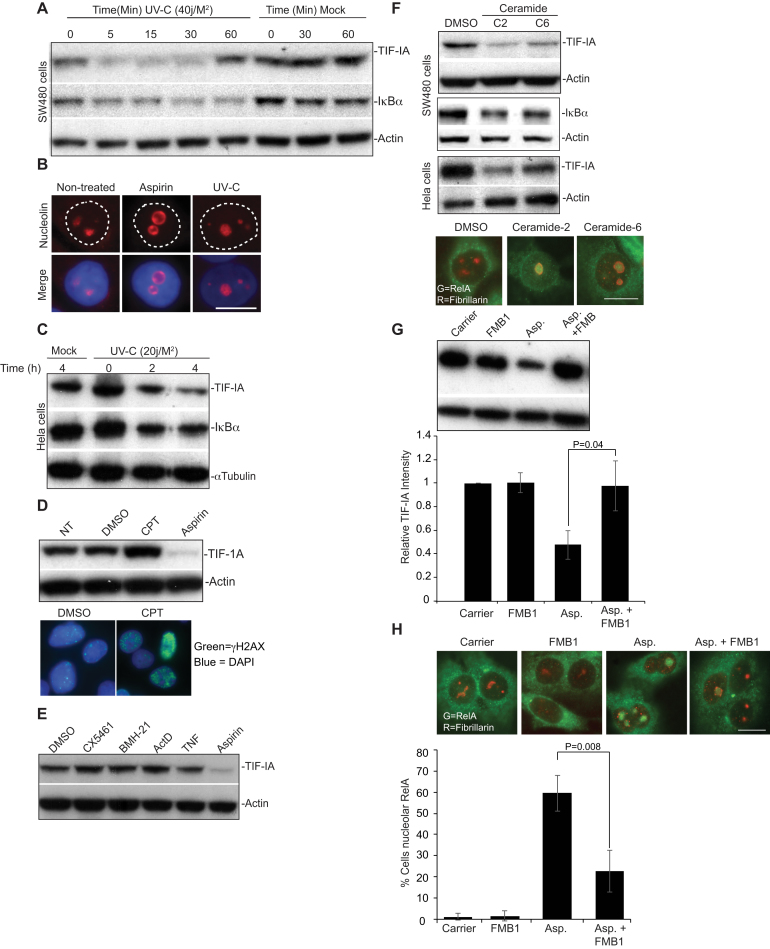
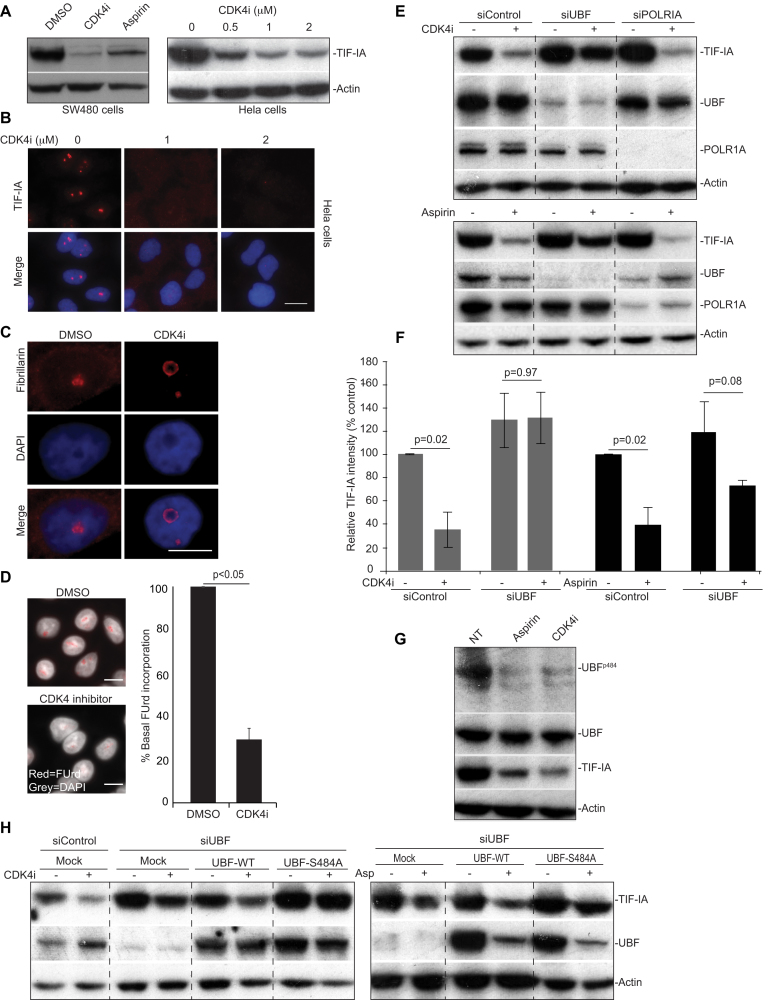
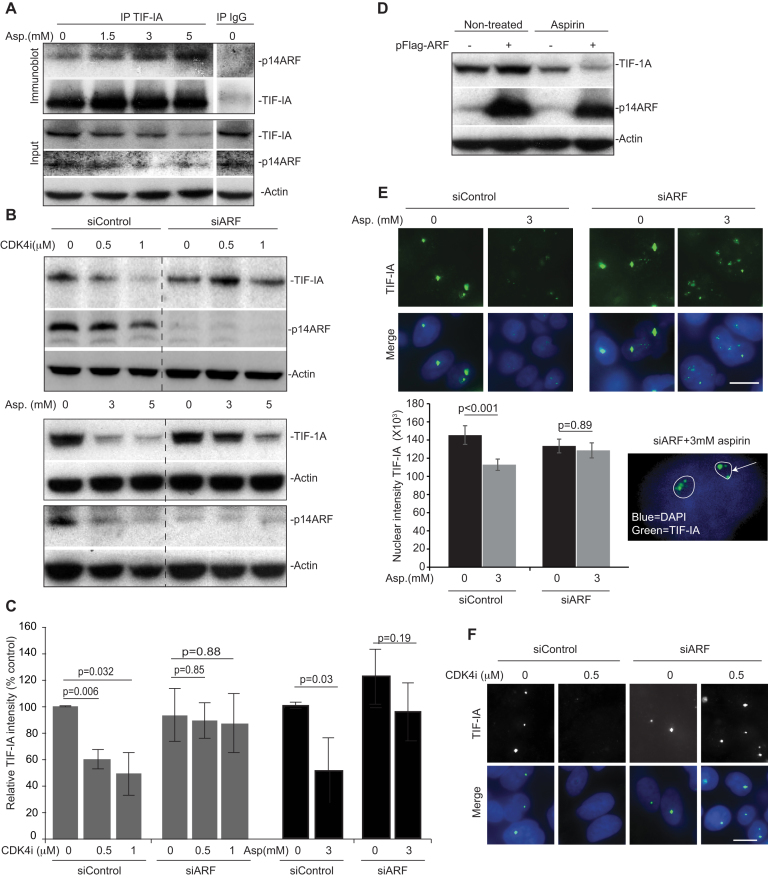
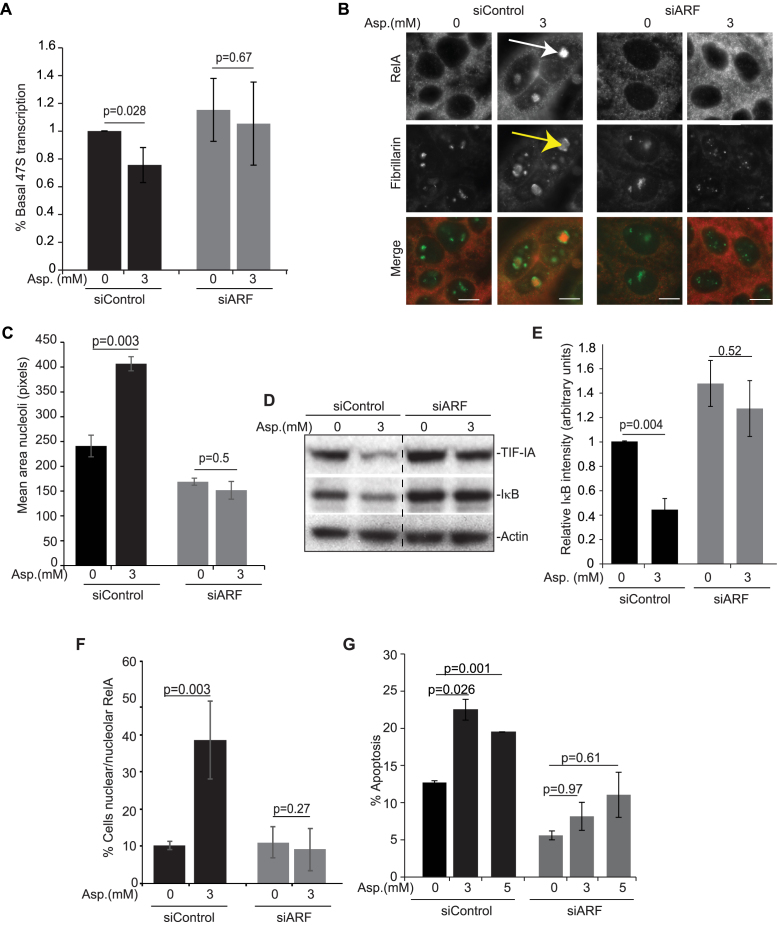
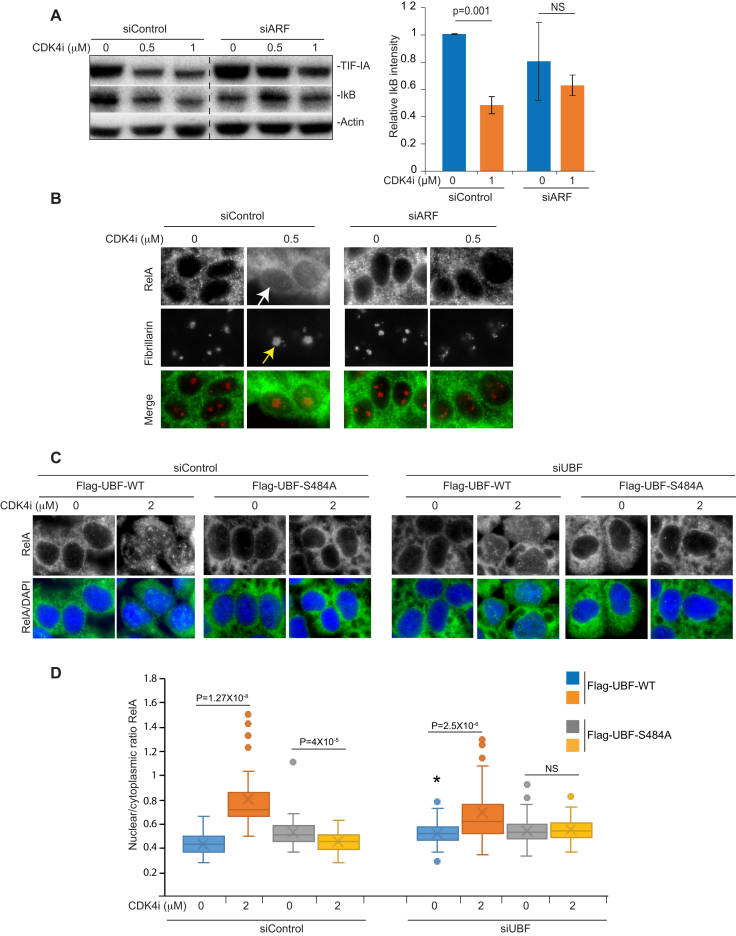
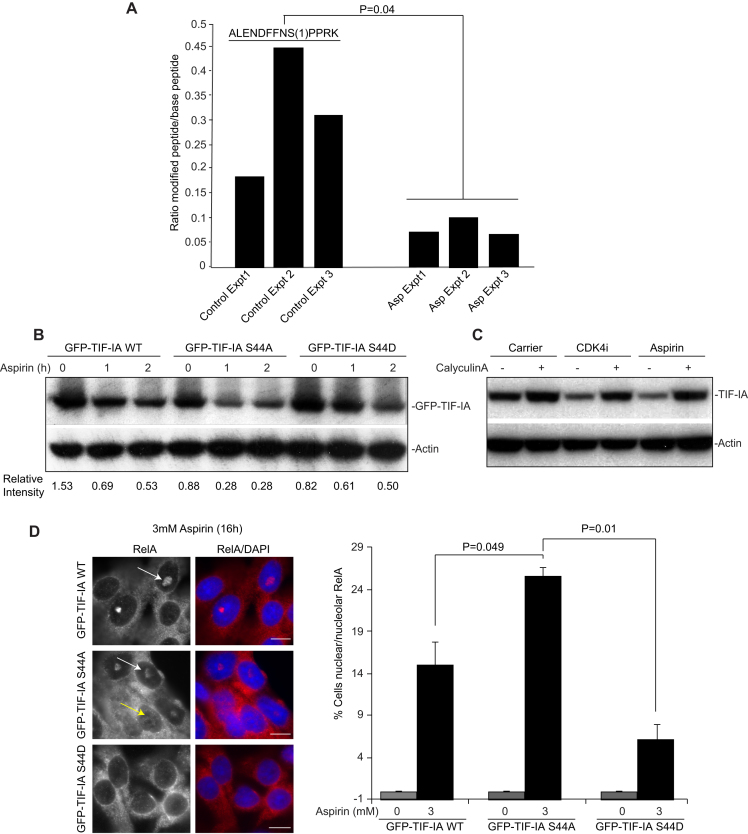
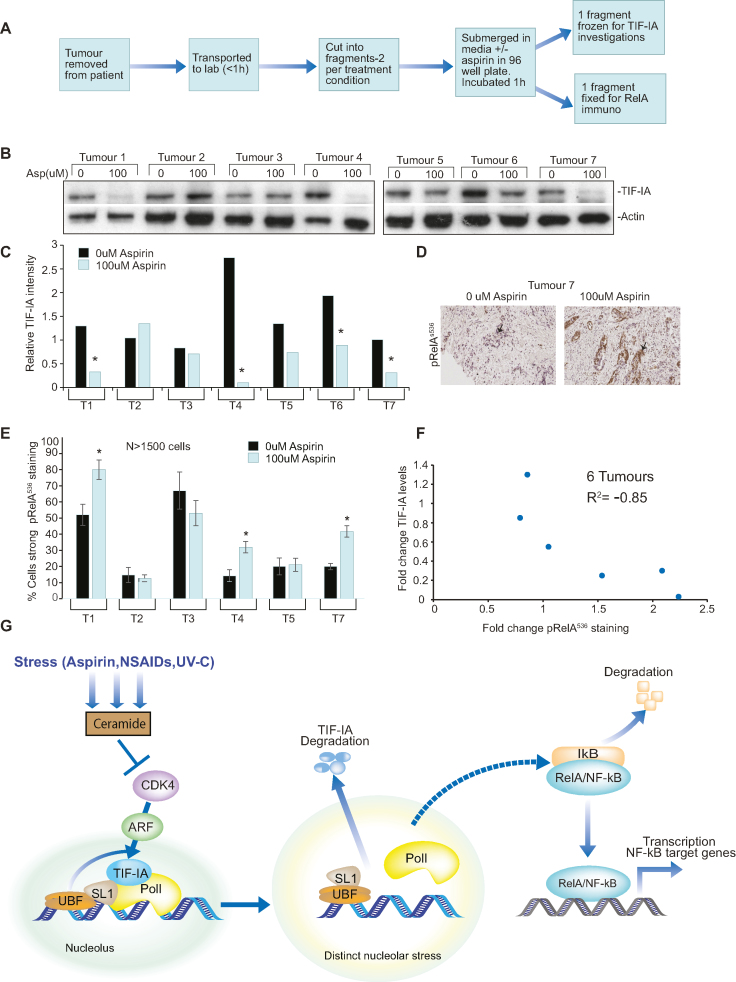
p53 as an effector of nucleolar stress is well defined, but p53 independent mechanisms are largely unknown. Like p53, the NF-κB transcription factor plays a critical role in maintaining cellular homeostasis under stress. Many stresses that stimulate NF-κB also disrupt nucleoli. However, the link between nucleolar function and activation of the NF-κB pathway is as yet unknown. Here we demonstrate that artificial disruption of the PolI complex stimulates NF-κB signalling. Unlike p53 nucleolar stress response, this effect does not appear to be linked to inhibition of rDNA transcription. We show that specific stress stimuli of NF-κB induce degradation of a critical component of the PolI complex, TIF-IA. This degradation precedes activation of NF-κB and is associated with increased nucleolar size. It is mimicked by CDK4 inhibition and is dependent upon a novel pathway involving UBF/p14ARF and S44 of the protein. We show that blocking TIF-IA degradation blocks stress effects on nucleolar size and NF-κB signalling. Finally, using ex vivo culture, we show a strong correlation between degradation of TIF-IA and activation of NF-κB in freshly resected, human colorectal tumours exposed to the chemopreventative agent, aspirin. Together, our study provides compelling evidence for a new, TIF-IA-NF-κB nucleolar stress response pathway that has in vivo relevance and therapeutic implications.


Figures

Figure 1.
Figure 1.
Silencing PolI complex components stimulates the NF-κB pathway. (A–C and E) SW480 cells were transfected with the indicated siRNA species. (A) Cells were co-transfected with pCMVβ and either a wild-type NF-κB-dependent luciferase reporter construct (3× κB ConA) or an equivalent plasmid with κB sites deleted (ConAΔκB). TNF (10 ng/ml, 4 h) acts as a control NF-κB stimulant. Luciferase activity was normalized using β-galactosidase activity. Results are presented as the percentage of relative NF-κB activity compared to cells transfected with 3× κB ConA-Luc/control siRNA (siControl). The mean of at least 3 repeats (±s.e.m.) is shown. Inset: Levels of pRelA536, nuclear RelA and UBF in whole cell (WCL) or nuclear lysates were determined upon UBF silencing using Western blot analysis. Actin acts as a control. (B) Immunoblots demonstrate- Left: reduced cytoplasmic IκBα, increased pRelAS536 and decreased cytoplasmic RelA upon silencing of TIF-IA and POLR1A. Nuclear extracts confirm efficient protein depletion. Right: increased nuclear RelA upon depletion of TIF-IA by two independent siRNAs. α-Tubulin, fibrillarin and actin act as loading controls. (C) Cells were co-transfected with IκB-luc (luciferase driven by full length IκB promoter) or ΔκB-IκB-luc (equivalent in which NF-κB sites are deleted) and pCMVβ. The percentage relative luciferase activity compared to siControl was calculated. Mean ± s.e.m. is shown (N = 3). (D) HCT116 cells were transfected as above. qRT-PCR was performed with primers for the NF-κB target genes IκBα and Bcl-xl. GAPDH was used to normalise. Results are presented as the fold increase in transcript compared to siControl. The mean (± s.e.m.) is shown. N = 3. (E) qRT-PCR with primers for the 47S pre-rRNA transcript measured levels of rRNA transcription. GAPDH was used to normalise. Results are presented as the percentage of relative 47S transcription compared to siControl. The mean (± s.e.m.) is shown. N > 3 (F) SW480 cells were treated with the PolI inhibitors CX5461 (500 nM), BMH-21 (4 uM), ActinomycinD (ActD, 1 ug/ml) or TNF (10 ng/ml), for 5 h. qRT-PCR measured levels of the 47S transcript as above. Mean ± s.e.m. is shown (N = 2). (G) SW480 cells were transfected with 3× κB ConA-Luc and pCMVβ. Twenty-fours hours later they were treated with inhibitors as in F. Graph shows the mean of at least two individual repeats ±s.e.m. P values throughout are compared to the respective control and were derived using a two tailed Student's t test. N values throughout are biological repeats. In (C), the P value for siUBF IκB-Luc versus siUBF ΔκB-IκB-Luc is also given. See Supplemental Figure S1 for additional cell lines and supporting data.
Figure 2.
Figure 2.
Degradation of TIF-IA and a distinct nucleolar phenotype precede aspirin effects on the NF-κB pathway. (AD) Aspirin (used as a model stress stimuli) induces a decrease in total cellular levels of TIF-IA, which precedes degradation of IκB and nuclear accumulation of RelA. SW480 cells were treated with aspirin (10mM) for the indicated times (A, C and D) Immunoblot analysis was performed on WCL with the indicated antibodies. (B) Immunomicrographs (63X) show levels and localisation of native TIF-IA. Below: The percentage of nuclei (as depicted by DAPI stain) with bright puncti of TIF-IA were quantified using ImageJ software. A minimum of 200 nuclei were analysed per experiment from at least 10 fields of view. N = 3. (D) Bottom: Immunomicrographs (×63) demonstrate accumulation of RelA in nuclei 2 h after aspirin exposure. (E and F) SW480 cells were treated with cyclohexamide (10 uM) alone or with aspirin (10 mM) for the times specified. (E) Immunoblot shows cellular levels of TIF-IA. (F) TIF-IA band intensities relative to actin were quantified using ImageJ. Results are presented as the percentage compared to the 0 h control. One representative experiment is shown. N = 2. (GI) Perturbation of nucleolar structure and function in response to aspirin. (G) rDNA transcription was quantified after aspirin (3 mM, 16 h) or actinocycinD (50 ng/ml, 2 h) treatment using qRT-PCR for the 47S transcript as above. Results are presented as the percentage of relative transcription compared to non-treated (NT) control. The mean (±s.e.m.) is shown. N = 4. (H) Representative DIC immunomicrographs (x63) showing the cellular localisation of components of the tripartite nucleolar structure in response to aspirin (10 mM, 8 h) and actinomycinD (50 ng/ml). Fibrillarin marks the dense fibrillar component and POLR1A the PolI complex in the fibrillar centre. Nucleolar area was quantified using ImageJ and fibrillarin staining (to define nucleoli). At least 250 cells were analysed per experiment. Graph depicts the mean (±s.e.m.) of three experiments. (I) rDNA transcription and nucleolar size were monitored over time in SW480 cells using qRT-PCR for the 47S transcript (as above) and ImageJ analysis of area devoid of DAPI staining (as a marker for nucleoli). At least 200 cells from 10 fields of view were analysed for nucleolar area. Graph depicts the mean of three experiments (±s.e.m). ***P < 0.001. Actin and Cu/ZnSOD act as loading controls throughout. Scale bars = 10 μm. P values throughout are compared to the respective control and were derived using a two tailed Student's t test. N values are biological repeats. See Supplemental Figure S2 for additional cell lines and supporting data.
Figure 3.
Figure 3.
TIF-IA degradation in response to multiple stress stimuli of NF-κB (A and C) SW480 or Hela cells were mock or UV-C (20 or 40 J/m2) irradiated. Following the times specified, immunoblots was performed on WCL with the indicated antibodies. (B) Immunomicrograph (×63) showing increased nucleolar area (as depicted by nucleolin staining) in SW480 cells in response to aspirin (3 mM, 16 h) or UV-C (40 J/m2, 2 h). (D) SW480 cells were treated with carrier, 10 μM Camptothecin (CPT) or aspirin (3 mM) for 16 h. Top: Western blot was performed with the indicated antibodies on WCL. Bottom: γH2AX immunocytochemistry confirmed DNA damage in response to CPT. (E) SW480 cells were treated with DMSO (carrier), CX5461 (500 nM), BMH-21 (4 μM), ActinomycinD (ActD, 50 ng/ml) or aspirin (10 mM) for 4 h, or TNF (10 ng/ml) for 30 min, WCL were examined by western blot using the antibodies indicated. (F) SW480 or Hela cells were treated with carrier (DMSO), ceramide-2 (C2, 10 uM)) or ceramide-6 (C6, 10 uM) for 16 h. Top: WCL were analysed by western blot with the indicated antibodies. Bottom: Representative immunomicrographs (×63) show the localisation of fibrillarin and RelA in SW480 cells. (G) SW480 cells were pre-treated with 100 μM FumonisinB1 (FMB1), prior to aspirin (3 mM,16 h) exposure. Top: Immunoblots indicate cellular levels of TIF-IA. TIF-IA intensity (relative to actin) was determined for each condition using ImageJ analysis. Results are presented as the percentage relative TIF-IA compared to control. Mean (±s.e.m.) is shown for six experiments. Bottom: Representative immunomicrograph (×63) demonstrating the cellular localisation of RelA. Fibrillarin acts as a nucleolar marker. The percentage of cells showing nucleolar RelA was determined manually. At least 200 cells from at least 5 fields of view per were counted per experiment. The results are the mean (±s.e.m.). N = 3. P values were derived using a two tailed Student's t test. Scale bars = 10 μm. Actin or α tubulin act as loading controls.
Figure 4.
Figure 4.
A role for CDK4 and UBF S484 in TIF-IA degradation. (AD) CDK4 inhibition induces degradation of TIF-IA and atypical changes to nucleolar structure. SW480 or Hela cells were treated with DMSO (carrier), aspirin (3 mM, 16 h) or the small molecule CDK4 inhibitor, 2-bromo-12,13-dihy-dro-indolo[2,3-a]pyrrolo[3,4-c] carbazole-5,7(6H)-dione (CDK4i, 2 uM or as indicated). (A) Anti-TIF-IA immunoblot performed on WCL. (B) Immunomicrographs (63×) demonstrating the levels and localisation of TIF-IA in Hela cells. (C) Immunomicrograph (63X) demonstrating re-localisation of fibrillarin in response to CDK4i in SW480 cells. (D) Left: Immunomicrographs (40×) depicting cells subjected to fluouridine (FUrd) run on assays. Right: Images were captured and analysed for FUrd incorporation using ScanR image analysis software. The results are presented as the percentage incorporation compared to control. The mean (±s.e.m.) of at least 1000 cells per experiment is shown. N=3 (E and F) SW480 cells were transfected with control, UBF or POLRIA siRNA. Forty-eight hours later cells were treated (+) with CDK4i (2 uM, 16 h), aspirin (3 mM 16 h) or the equivalent carriers (–). (E) Western blot analysis was performed with the indicated antibodies. (F) TIF-IA intensity (relative to actin) was determined for each condition using ImageJ analysis. Results are presented as the percentage relative TIF-IA compared to carrier treated, siControl. Mean (± s.e.m.) is shown for 2 (CDK4i) and 3 (aspirin) experiments. (G and H) Identification of a role for residue 484 of UBF. (G) SW480 cells were treated with aspirin and CDK4i as above. Western blot analysis was performed with antibodies to phosphorylated (UBF S484) and native UBF. (H) SW480 cells were transfected with control or UBF siRNA then either mock transfected or transfected with Flag-UBF-wild type (WT) or a phospho-mutant-flag-UBFS484A. Eight hours later, transfected cells were treated with CDK4i and aspirin (asp.) as above. Immunoblot was performed with the indicated antibodies. Scale bar = 10 μm. Actin acts as a loading control throughout. P values were derived using a two tailed Student's t test. See also Supporting Supplemental Figure S3.
Figure 5.
Figure 5.
Identification of a role for p14ARF in TIF-IA degradation. (A) TIF-IA interacts with p14ARF in response to aspirin. SW480 cells were treated with 0–5 mM aspirin for 16 h. Immunoprecipitation was carried out on WCL using antibodies to TIF-IA and IgG control. Precipitated proteins were subjected to western blot analysis with the indicated antibodies. Input levels are shown. (BF) Silencing of P14ARF is required for stress-mediated degradation of TIF-IA. (B, C, E and F) SW480 cells were transfected with control or p14ARF siRNA (siARF) then treated for 16 h with CDK4i (0–1 μM) or aspirin (0–3 mM). (B) Immunoblot analysis was performed on WCL with the indicated antibodies. (C) TIF-IA levels relative to actin were quantified using ImageJ analysis. Graph shows the mean (±s.e.m.) compared to non-treated, siControl. N = 3. (E and F) Immunomicrographs (×63) show the levels and localisation of TIF-IA in fixed cells. (E) IPlab software quantified nuclear (as depicted by DAPI staining) intensity of TIF-IA. Data are the mean (±s.e.m.) of >150 nuclei. N = 3. Inset shows nucleolar (outlined) TIF-A in p14ARF transfected cells treated with aspirin. (D) SW480 cells were transfected with pcDNA3 control plasmid (–) or pcDNA3-p14ARF (+) then either non-treated or treated with aspirin (3 mM, 16 h). Immmunoblot was performed on WCL with the indicated antibodies. Actin acts as a loading control throughout. Scale bar = 10 μm. N values are biological repeats. P values were derived using a two-tailed Student's t test. See also supporting Supplemental Figure S4.
Figure 6.
Figure 6.
Blocking TIF-IA degradation inhibits aspirin effects on nucleoli and the NF-κB pathway. (AG) Blocking TIF-IA degradation, using siRNA to p14ARF, abrogates aspirin-mediated inhibition of rDNA transcription, nucleolar enlargement, degradation of IκB, nuclear/nucleolar translocation of RelA and apoptosis. SW480 cells were transfected with control or p14ARF siRNA as in Figure 6 then treated with aspirin (Asp.) at the concentrations specified. (A) qRT-PCR with primers for the 47S pre-rRNA transcript measured levels of rRNA transcription. GAPDH was used to normalise. Results are presented as the percentage of relative 47S transcription compared to the equivalent 0mM control for each siRNA. Mean (±s.e.m.) of 3 is shown. (B) Immunocytochemistry was performed on fixed cells with the indicated antibodies. Arrows indicate nucleolar RelA (white) and enlarged, segregated nucleoli (yellow). (C) Nucleolar area was quantified in at least 150 cells using IPlab software with fibrillarin as a nucleolar marker. Mean (± s.e.m.) is shown. N = 3. (D) Immunoblots demonstrating cytoplasmic levels of IκBα. (E) ImageJ software measured IκBα intensity relative to actin. The results are the mean of 3 experiments ±s.e.m. (F) Immunocytochemistry was performed as in B. The percentage of cells in the population showing nucleolar RelA was quantified manually. At least 6 fields of view and >100 cells were analysed per condition. The mean ± s.e.m is shown. N = 3. (G) Annexin V apoptosis assays were performed. The percentage of cells undergoing apoptosis was determined by fluorescent microscopy. At least 200 cells were analysed for each sample. The results are the means of two independent experiments ± s.e.m. Actin acts as a loading control. Scale bar = 10 μm. P values were derived using a two-tailed Student's t test. N values are biological repeats.
Figure 7.
Figure 7.
Blocking TIF-IA degradation inhibits CDK4i effects on nucleoli and the NF-κB pathway. (A and B) SW480 cells were transfected with control or p14ARF siRNA as above then treated with CDK4i at the concentrations specified. (A) Immunoblot demonstrating cytoplasmic levels of IκBα. Right: ImageJ software measured IκBα intensity relative to actin. The results are the mean of two experiments ± s.e.m. (B) Immunocytochemistry was performed on fixed cells with the indicated antibodies. Arrows indicate increased nuclear RelA (white) and nucleolar area (yellow) in response to CDK4i in siControl transfected cells. (C) SW480 cells were transfected with the indicated siRNA species alongside Flag-UBF WT or S484A (as in Figure 4H). Following CDK4i treatment (0–2 μM), immunocytochemistry was performed on fixed cells with antibodies to RelA. ImageJ was used to quantify the nuclear to cytoplasmic intensity of RelA. A Whisker plot shows nuclear/cytoplasmic ratios for at least 100 cells per condition per experiment (N = 2). Actin acts as a loading control throughout. Scale bar = 10μm. P values were derived using a two-tailed Student's t test. *P = 0.05 when compared to siControl.
Figure 8.
Figure 8.
Dephosphorylation at S44 is critical for stress-mediated TIF-IA degradation and activation of the NF-κB pathway. (A) Label-free quantitative mass spectrometry (MaxLFQ), performed on immunoprecipitated endogenous protein, was used to screen for changes in TIF-IA phosphorylation in response to aspirin (0 or 10 mM, 2 h). Bar graph represents the ratio of phosphorylated to de-phosphorylated peptide in the presence and absence of aspirin, for three independent experiments. The peptide is shown, with the localisation of the phosphorylation site in brackets. (B) SW480 cells were transfected with the indicated GFP-TIF-IA mutants then treated with aspirin (0 or 10 mM) for the times specified. Immunoblots were performed on WCL with the indicated antibodies. The intensity of TIF-IA relative to actin is shown for one representative experiment (N = 3). (C) SW480 cells were pre-treated with CalyculinA (5 nM) for 4 h prior to aspirin (10 mM) or CDK4i (4 μM) exposure (4 h). Immunoblots were performed on WCL with the indicated antibodies. (D) SW480 cells were transfected with the indicated GFP-tagged plasmids then treated with aspirin (0 or 3 mM, 16 h). (Left) Immunomicrographs (×63) demonstrate the localisation of RelA in aspirin treated cell populations. DAPI staining depicts nuclei. (Right) The percentage of cells in the population showing nuclear (yellow arrow) or nucleolar (white arrow) RelA was quantified manually. Data are the mean of at least five fields of view (>150 cells), for two independent experiments (±s.e.m.). Bars, 10 μm. P values were derived as above.
Figure 9.
Figure 9.
TIF-IA degradation correlates with NF-κB pathway activation in human clinical samples. (A) Diagram depicting workflow of ex vivo culture. Resected colorectal tumour biopsies were immediately transferred to the lab, washed, immersed in culturing media in 96-well plates then exposed to 0 or 100 uM aspirin for 1 h. One piece of tissue was fixed for immunohistochemistry while another was frozen for protein analysis. This was carried out for seven patients. (B) Immunoblot was performed on WCL with the indicated antibodies. (C) ImageJ quantified TIF-IA intensity relative to actin. * Tumours showing a >2-fold decrease in relative levels of TIF-IA in response to aspirin were deemed to respond. (D and E) Immunohistochemistry was performed on sections from paraffin embedded tissue with antibodies to RelAp536. (D) An example immunomicrograph. Arrows indicate epithelial cells. (E) Leica QWin plus image analysis software, with scripts written in house, was used to quantify the nuclear RelAp536 intensity in digitized images. Three distinct areas of tissue and at least 1500 cells were analysed per section. Data presented are the % cells showing moderate+strong RelAp536 staining, as indicated by image analysis software. * Significant (P < 0.05) difference between the % stained cells in treated and non-treated sections. (F) Graph showing the relationship between aspirin-induced changes in TIF-IA and RelAp536 staining for six individual tumours. Pearsons correlation coefficient (r2) was used to examine the relationship. (G) Proposed model. Generation of ceramide by specific stresses inhibits CDK4 kinase activity, which induces degradation of TIF-IA in a manner dependent on UBF/p14ARF. The consequent disruption of the PolI pre-initiation complex causes distinct changes in nucleolar architecture and triggers a protein or pathway (as yet unknown) which causes phosphorylation and degradation of IκBα, nuclear translocation of RelA and ultimately, transcription of a gene programme that alters cell phenotype. We propose the nature of this transcriptional program is cell type and stimulus dependent.

References

    1. Mayer C., Grummt I.. Cellular stress and nucleolar function. Cell Cycle. 2005; 4:1036–1038. - PubMed
    1. Boulon S., Westman B.J., Hutten S., Boisvert F.M., Lamond A.I.. The nucleolus under stress. Mol. Cell. 2010; 40:216–227. - PMC - PubMed
    1. Boisvert F.M., Lam Y.W., Lamont D., Lamond A.I.. A quantitative proteomics analysis of subcellular proteome localization and changes induced by DNA damage. Mol. Cell Proteomics. 2010; 9:457–470. - PMC - PubMed
    1. Deisenroth C., Zhang Y.. Ribosome biogenesis surveillance: probing the ribosomal protein-Mdm2-p53 pathway. Oncogene. 2010; 29:4253–4260. - PubMed
    1. Rubbi C.P., Milner J.. Disruption of the nucleolus mediates stabilization of p53 in response to DNA damage and other stresses. EMBO J. 2003; 22:6068–6077. - PMC - PubMed

Publication types

MeSH terms