. 2018 Jun 19;90(12):7721-7729.
doi: 10.1021/acs.analchem.8b01624. Epub 2018 Jun 6.

Rosetta Protein Structure Prediction from Hydroxyl Radical Protein Footprinting Mass Spectrometry Data

Affiliations

Rosetta Protein Structure Prediction from Hydroxyl Radical Protein Footprinting Mass Spectrometry Data

Melanie L Aprahamian et al. Anal Chem. .

Abstract

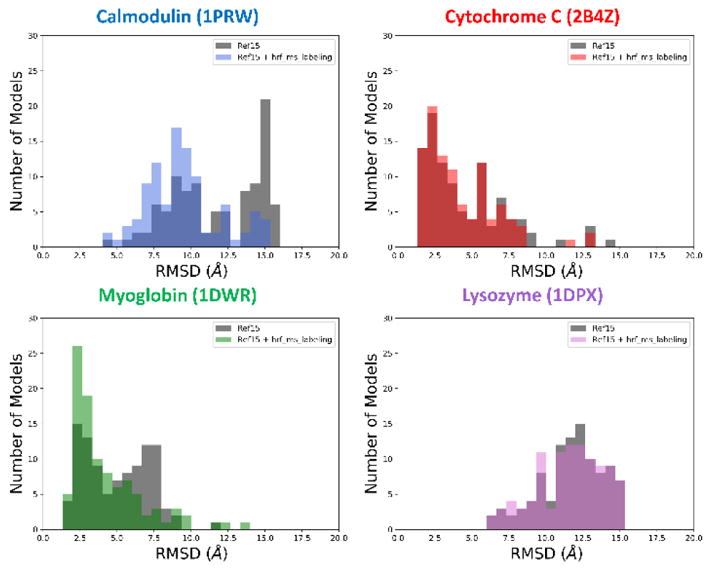
In recent years mass spectrometry-based covalent labeling techniques such as hydroxyl radical footprinting (HRF) have emerged as valuable structural biology techniques, yielding information on protein tertiary structure. These data, however, are not sufficient to predict protein structure unambiguously, as they provide information only on the relative solvent exposure of certain residues. Despite some recent advances, no software currently exists that can utilize covalent labeling mass spectrometry data to predict protein tertiary structure. We have developed the first such tool, which incorporates mass spectrometry derived protection factors from HRF labeling as a new centroid score term for the Rosetta scoring function to improve the prediction of protein tertiary structures. We tested our method on a set of four soluble benchmark proteins with known crystal structures and either published HRF experimental results or internally acquired data. Using the HRF labeling data, we rescored large decoy sets of structures predicted with Rosetta for each of the four benchmark proteins. As a result, the model quality improved for all benchmark proteins as compared to when scored with Rosetta alone. For two of the four proteins we were even able to identify atomic resolution models with the addition of HRF data.


Figures

Figure 1
Figure 1
Plot of the per-residue neighbor score for labeled residue ias a function of the absolute difference between its observed and predicted neighbor counts (|diff|i). The score function fully rewarded (with a score of −1) residues that have an |diff|i < 5 and gave no reward (a score of 0) to residues that have an |diff|i > 10.
Figure 2
Figure 2
(A) Rosetta score versus RMSD to the native structure plots for 20,000 models generated using Rosetta ab initio for each of the four benchmark proteins. The top scoring model is represented as a star on each plot. (B) The top scoring models from the Rosetta score versus RMSD distributions in A (color) superimposed upon the respective native model (grey). (C) Rosetta score + hrf_ms_labeling versus RMSD to the native structure plots for each of the four benchmark proteins after rescoring with the new score term. The top scoring model is represented as a star on each plot. (D) The top scoring models from the Rosetta score + hrf_ms_labeling rescoring distributions in C (color) superimposed upon the respective native model (grey).
Figure 3
Figure 3
Linear regression between the neighbor count and the natural logarithm of the experimental protection factor (lnPF) for ten relaxed native models of calmodulin. The linear fit along with its coefficient of determination are indicated on the plot.
Figure 4
Figure 4
(A) Plot of predicted and observed neighbor counts for ten relaxed native models for each of the four benchmark proteins. (B) Plot of predicted and observed neighbor counts for ten models with good Rosetta scores and high RMSD values (> 10 Å) as compared to their respective natives for each of the four benchmark proteins. For both plots, the dashed black line represents the theoretical perfect fit (the predicted matches the observed perfectly) and the yellow and cyan lines represent the inner (d1 = 5) and outer delta (d2 = 10) lines respectively.
Figure 5
Figure 5
Histograms for each of the four benchmark proteins showing the RMSD frequency of the top 100 scoring models from both the ensembles generated using Rosetta and the ensembles obtained after rescoring with hrf_ms_labeling. The histograms are plotted ranging from 0 to 20 Å with bin widths of 0.67 Å.

References

    1. Fenn JB, Mann M, Meng CK, Wong SF, Whitehouse CM. Electrospray ionization for mass spectrometry of large biomolecules. Science. 1989;246(4926):64–71. - PubMed
    1. Link AJ, Eng J, Schieltz DM, Carmack E, Mize GJ, Morris DR, Garvik BM, Yates JR., III Direct analysis of protein complexes using mass spectrometry. Nature Biotechnology. 1999;17(7):676. - PubMed
    1. Aebersold R, Mann M. Mass spectrometry-based proteomics. Nature. 2003 - PubMed
    1. Küster B, Mann M. Identifying proteins and post-translational modifications by mass spectrometry. Current Opinion in Structural Biology. 1998;8(3):393–400. - PubMed
    1. Pi J, Sael L. Mass Spectrometry Coupled Experiments and Protein Structure Modeling Methods. International Journal of Molecular Sciences. 2013;14(10):20635–20657. - PMC - PubMed

Publication types