Age-related changes in upper limb motion during typical development
- PMID: 29874278
- PMCID: PMC5991355
- DOI: 10.1371/journal.pone.0198524
Age-related changes in upper limb motion during typical development
Abstract
Background and aim: Understanding the maturation of upper limb (UL) movement characteristics in typically developing (TD) children is key to explore UL deficits in those with neurodevelopmental disorders. Three-dimensional motion analysis (3DMA) offers a reliable tool to comprehensively evaluate UL motion. However, studies thus far mainly focused on specific pre-defined parameters extracted from kinematic waveforms. Here, we investigated age-related differences in UL movement characteristics over the entire movement cycle in TD children.
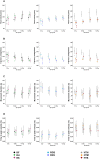
Participants and methods: We assessed the non-dominant UL of 60 TD children (mean age 10y3m±3y1m) using 3DMA during eight tasks: reaching (forwards (RF), upwards (RU), sideways (RS)), reach-to-grasp (sphere (RGS), vertical cylinder (RGV)) and activities-of-daily-living mimicking tasks (hand-to-head (HTH), hand-to-mouth (HTM), hand-to-shoulder (HTS)). We investigated differences between four age-groups (5-7y, 8-10y, 11-12y, 13-15y) in: (1) spatiotemporal parameters (movement duration, peak velocity, time-to-peak velocity and trajectory straightness), and (2) 12 UL joint angles, using Statistical Parametric Mapping (SPM).
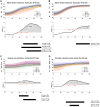
Results: We found that the 5-7y children moved with lower peak velocity and less straight trajectories compared to the 11-12y group (peak velocity: RS, HTS, p<0.01; trajectory: RU, RS, RGV, HTS, p<0.01) and the 13-15y group (peak velocity: RF, RS, RGS, RGV, HTH, HTS, p<0.01; trajectory, all tasks, p<0.01). The 5-7y children showed increased scapular protraction compared to older children (8-10y and 11-12y, HTS), as well as increased scapular medial rotation compared to the 13-15y group (RGS). During RU, the 5-7y children moved more towards the frontal plane (shoulder), unlike the 13-15y group. Lastly, the 5-7y group used less elbow flexion than older children (11-12y and 13-15y) during HTH and HTS.
Discussion and conclusion: In conclusion, our results point toward a maturation in UL movement characteristics up to age 11-12y, when UL motion seemed to reach a plateau. The reference values provided in this study will help to further optimize the interpretation of UL deficits in children with neurodevelopmental disorders.
Conflict of interest statement
The authors have declared that no competing interests exist.
Figures


References
-
- Chen C-M, Chen C-Y, Wu KP, Chen C-L, Hsu H-C, Lo S-K. Motor Factors Associated with Health-Related Quality-of-Life in Ambulatory Children with Cerebral Palsy. American Journal of Physical Medicine & Rehabilitation. 2011;90: 940–947. - PubMed
-
- Janssen MMHP, Bergsma A, Geurts ACH, de Groot IJM. Patterns of decline in upper limb function of boys and men with DMD: an international survey. Journal of Neurology. 2014;261: 1269–1288. doi: 10.1007/s00415-014-7316-9 - DOI - PubMed
-
- Schneiberg S, Sveistrup H, McFadyen B, McKinley P, Levin MF. The development of coordination for reach-to-grasp movements in children. Experimental Brain Research. 2002;146: 142–154. doi: 10.1007/s00221-002-1156-z - DOI - PubMed
-
- Gilliaux M, Dierckx F, Vanden Berghe L, Lejeune TM, Sapin J, Dehez B, et al. Age Effects on Upper Limb Kinematics Assessed by the REAplan Robot in Healthy School-Aged Children. Annals of Biomedical Engineering. 2015;43: 1123–1131. doi: 10.1007/s10439-014-1189-z - DOI - PubMed
-
- Berthier NE, Keen R. Development of reaching in infancy. Experimental Brain Research. 2006;169: 507–518. doi: 10.1007/s00221-005-0169-9 - DOI - PubMed
Publication types
MeSH terms
LinkOut - more resources
Full Text Sources
Other Literature Sources

