. 2018 Jun 5;23(10):3102-3111.
doi: 10.1016/j.celrep.2018.05.001.

Regulation of Mesenchymal Stem to Transit-Amplifying Cell Transition in the Continuously Growing Mouse Incisor

Affiliations

Regulation of Mesenchymal Stem to Transit-Amplifying Cell Transition in the Continuously Growing Mouse Incisor

Zhengwen An et al. Cell Rep. .

Abstract

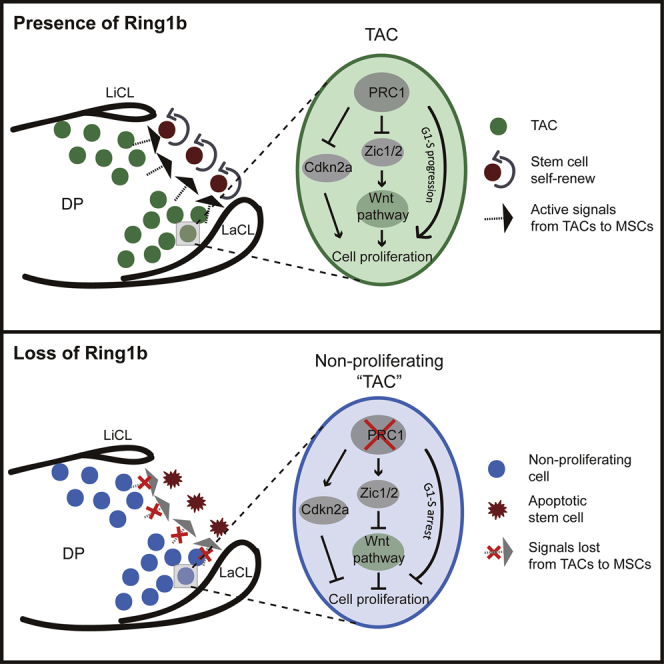
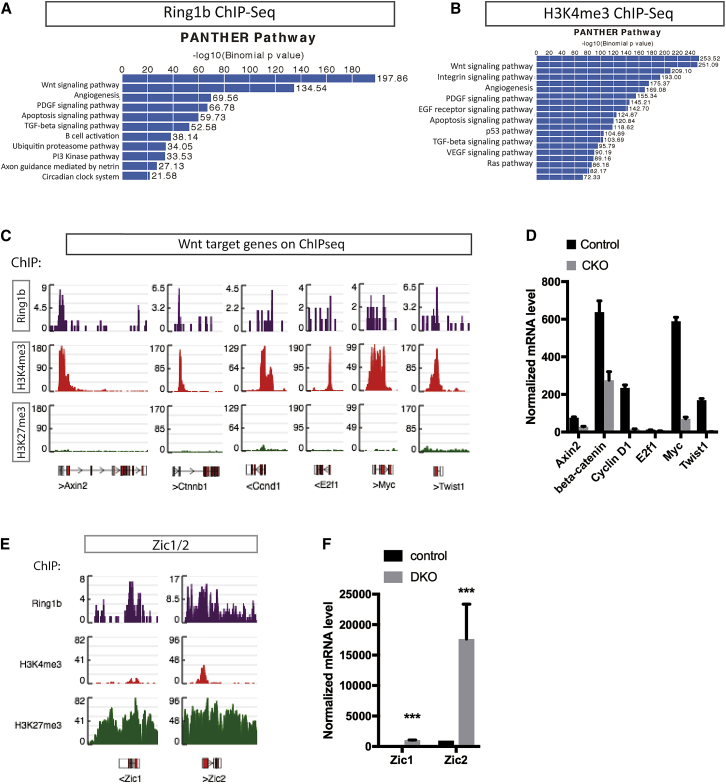
In adult tissues and organs with high turnover rates, the generation of transit-amplifying cell (TAC) populations from self-renewing stem cells drives cell replacement. The role of stem cells is to provide a renewable source of cells that give rise to TACs to provide the cell numbers that are necessary for cell differentiation. Regulation of the formation of TACs is thus fundamental to controlling cell replacement. Here, we analyze the properties of a population of mesenchymal TACs in the continuously growing mouse incisor to identify key components of the molecular regulation that drives proliferation. We show that the polycomb repressive complex 1 acts as a global regulator of the TAC phenotype by its direct action on the expression of key cell-cycle regulatory genes and by regulating Wnt/β-catenin-signaling activity. We also identify an essential requirement for TACs in maintaining mesenchymal stem cells, which is indicative of a positive feedback mechanism.

Keywords: Ring1b; Wnt; apoptosis; cell cycle; mesenchyme; polycomb; proliferation; transit-amplifying cell.


Figures

None
Graphical abstract
Figure 1
Figure 1
MSC Niche in the Mouse Incisor (A and B) To label fast-cycling cells (TACs), postnatal day 5 pups were given a single EdU injection (3.3 μg/g BW) and sacrificed after 16–24 hr (A). To identify slow-cycling cells, postnatal day 5 pups were given daily EdU injections (3.3 μg/g BW) for 4 weeks and traced for 2–6 months before tissue collection (B). Click-it EdU image kit was used for EdU detection on sagittal sections of mouse incisors. EdU was labeled with Alexa Fluor 594 dye and DAPI was used for nuclear labeling. (C–G) Immunofluorescence showed that Ring1b (C) co-localized with EdU-labeled TACs (D) in dental mesenchyme (82% EdU+ are Ring1b+, and 70% Ring1b+ are EdU+). DAPi staining (E), merged image (F), and (G) Enlarged field of (F) showing localization of Ring1b and EdU+ in the TAC region. (H–K) Immunolocalization of Ring1b (H) and slow-cycling (label-retaining) cells (I). (J) Merged image. (K) Tilescan image of (J). (L) Loss of Ring1a/b showed decreased cell proliferation identified by Ki67 staining. N ≥ 3 mice per group.
Figure 2
Figure 2
Genome-wide Landscapes of PRC1 in TACs (A) ChIP-seq on Ring1b, H3K4me3, and H3K27me3 identified 3,939, 14,361, and 11,341 gene loci, respectively. There were 2,624 gene loci co-occupied by both H3K4me3 and Ring1b, whereas 1,591 loci were marked with H3K27me3 and Ring1b. (B) Genome browser snapshots representing repressive and active gene loci regulated by Ring1b. (C) BigWIG metrics identified five clusters across targets in H3K4me3 and H3K27me3 active regions. (D) Snapshots of genome browser showed the enrichment of PRC1 components in TACs. (E and F) Double immunolocalization of Ki67 (E) with Cbx2 and Ring1b (F), respectively, in the TAC region. (G) Flow-sorted EdU+ fast-cycling cells were collected by cytospin and immunofluorescence staining showed co-localization of Ring1b and Cbx2 on EdU+ cells. (H) Co-immunoprecipitation with H2AK119ub1 and H3K27me27 on primary dental pulp cells by Ring1b antibody identified interaction of Ring1b and H3K27m3 rather than H2AK119ub1. (I) Conditional knock out of Ring1b caused decreased levels of H3K27me3 demonstrated by western blots. Lamin B antibody was used as an internal loading control. N ≥ 5 mice per group.
Figure 3
Figure 3
Gene Expression and ChIP-SeqI Identify the Role of PRC1 on Cell-Cycle Regulation (A) Whole-genome microarrays revealed that 499 genes were upregulated and 466 genes were downregulated with >2-fold change (p < 0.05) upon Ring1a/b deletion represented by volcano plots. (B) PCA plots identified and grouped the samples by similarities and differences. (C) Heatmaps representing hierarchical clustering of differentially expressed genes following loss of Ring1a/b (n = 3 biological replicates, minimum four mice per group). (D) WiKiPathway revealed the top five pathways to be related to cell-cycle regulation. (E) G1-S control and DNA replication genes were found downregulated upon Ring1 deletion on gene microarray datasets and (F) the enrichment loci also were co-marked by Ring1b and H3K4me3 but not with H3K27me3 on ChIP-seq datasets. (G) Cell-cycle inhibitor Cdkn2a was found to be upregulated in Ring1b cells and (H) identified as a direct target of Ring1b marked by H3K27me3. A single peak of H3K4me3 is present upstream of the Cdkn2a start site in a region also bound by H3K27me3. Highlighted region shows the gene transcription region for Cdkn2a. (I and J) Real-time PCR confirmed the (I) upregulated cell-cycle genes and downregulation (J) of Cdkn2a upon Ring1 deletion in mouse dental pulp cells. N ≥ 3 mice per group. p < 0.05, ∗∗p < 0.01, and ∗∗∗p < 0.001 by Student’s t test. Data presented as means ± SEMs.
Figure 4
Figure 4
ChIP-Seq Analysis Reveals Ring1b Targets in the Wnt Pathway (A and B) GO enrichment analysis using PANTHER pathway identified Wnt/β-catenin signaling as the top pathway in Ring1b (A) and H3K4me3 (B) ChIP-seq datasets. (C) Peak calling showed the enrichment of Wnt target genes co-marked by Ring1b and H3K4me3 but no enrichment with H3K27me3. (D) Validation of downregulated Wnt target genes by Ring1b using real-time PCR. N ≥ 3 mice per group. p < 0.05 by Student’s t test. Data presented as means ± SEMs. (E) Genomic view of Zic1/2 co-occupying the same loci as Ring1b and H3K27me3 rather than H3K4me3. (F) Zic1/2 were upregulated following deletion of Ring1a/b identified by real-time PCR. N ≥ 3 mice per group. ∗∗∗p < 0.001 by Student’s t test. Data presented as means ± SEMs.
Figure 5
Figure 5
Wnt Signals in the MSC Niche Lineage tracing of Axin2 progeny (GFP+) at 1 day, 3 days, 1 week, 2 weeks, and 4 weeks post-tamoxifen injection of Axin2ERT2cre;mTmG mice on sagittal sections of mouse incisors. GFP+ cells were detected in the TAC region of dental mesenchyme close to the epithelial cervical loop after 1 day and increased in number by 3 days post-tamoxifen. Axin2-derived cells (GFP+) showed an increased contribution to dental pulp cells and odontoblasts toward the apical end by 1 week and progressively advanced toward the tip of the incisor by 2 weeks post-tamoxifen. There were no GFP+ cells detected in the mouse incisor after 4 weeks post-tamoxifen. Green is GFP+, red is Tomato+, and blue is DAPI for nuclear staining. N ≥ 3 mice per group. Scale bar: 250 μm.
Figure 6
Figure 6
Maintenance of Stem Cell Stability by PRC1 (A) Schematic illustration demonstrated EdU retention assay to detect slow-cycling stem cells. (B) EdU+ cells were distinctly localized between the labial and lingual aspects of the cervical loop, but they disappeared by 96 hr post-tamoxifen induction of Ring1 deletion. (C) Tunel assays revealed apoptotic cells in the stem cell zone in Ring1 cells, whereas no obvious apoptosis was detected in control incisors. (D) Reduced cell proliferation was detected in Wlsflox/flox;Axin2CreERT2 marked by BrdU-labeled cells. (E) Annexin V+ apoptotic cells were visible in the stem cell zone 2 days post-tamoxifen on Ring1a−/−;Ring1bflox/flox:Axin2CreERT2 mice compared to controls. N ≥ 3 mice per group.

References

    1. An Z., Sabalic M., Bloomquist R.F., Fowler T.E., Streelman T., Sharpe P.T. A quiescent cell population replenishes mesenchymal stem cells to drive accelerated growth in mouse incisor. Nat. Commun. 2018;9:378. - PMC - PubMed
    1. Aranda S., Mas G., Di Croce L. Regulation of gene transcription by polycomb proteins. Sci. Adv. 2015;1:e1500737. - PMC - PubMed
    1. Bernstein E., Duncan E.M., Masui O., Gil J., Heard E., Allis C.D. Mouse polycomb proteins bind differentially to methylated histone H3 and RNA and are enriched in facultative heterochromatin. Mol. Cell. Biol. 2006;26:2560–2569. - PMC - PubMed
    1. Biehs B., Hu J.K.-H., Strauli N.B., Sangiorgi E., Jung H., Heber R.-P., Ho S., Goodwin A.F., Dasen J.S., Capecchi M.R. BMI1 represses Ink4a/Arf and Hox genes to regulate stem cells in the rodent incisor. Nat. Cell Biol. 2013;15:846–852. - PMC - PubMed
    1. Brocardo M., Henderson B.R. APC shuttling to the membrane, nucleus and beyond. Trends Cell Biol. 2008;18:587–596. - PubMed

Publication types

Substances