. 2018 Jun 5;114(11):2665-2678.
doi: 10.1016/j.bpj.2018.04.043.

The Role of Network Architecture in Collagen Mechanics

Affiliations

The Role of Network Architecture in Collagen Mechanics

Karin A Jansen et al. Biophys J. .

Abstract

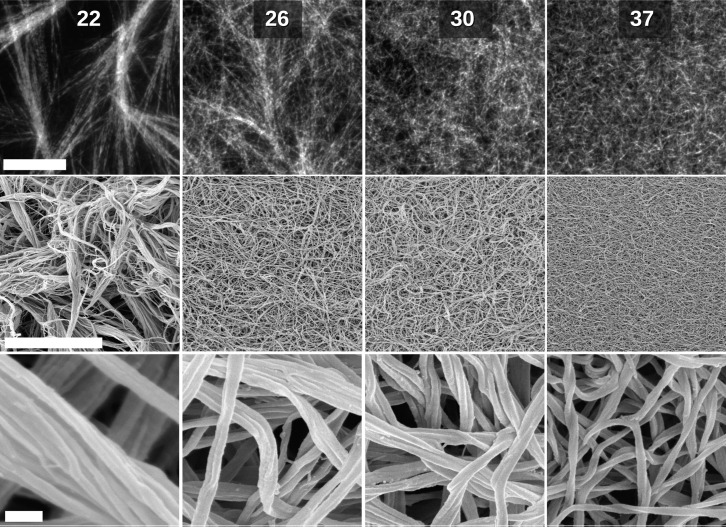
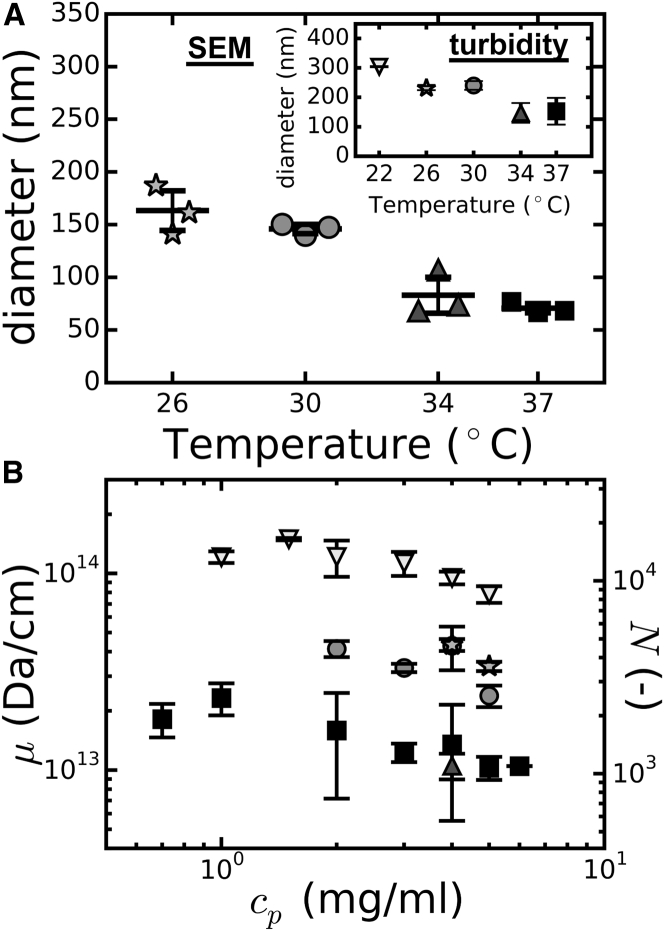
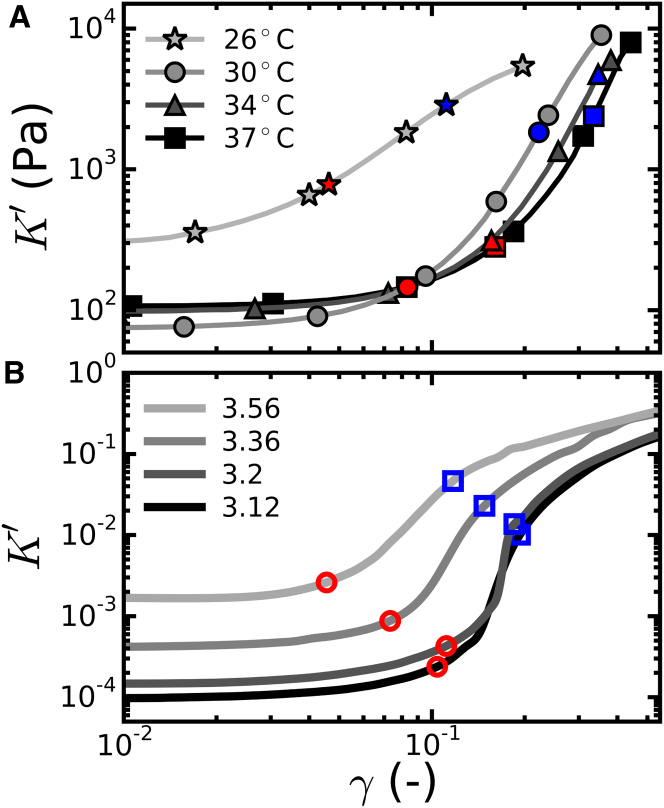
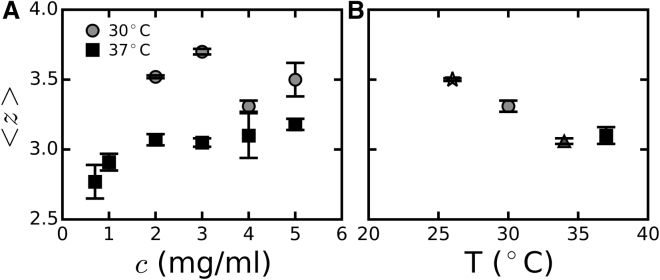
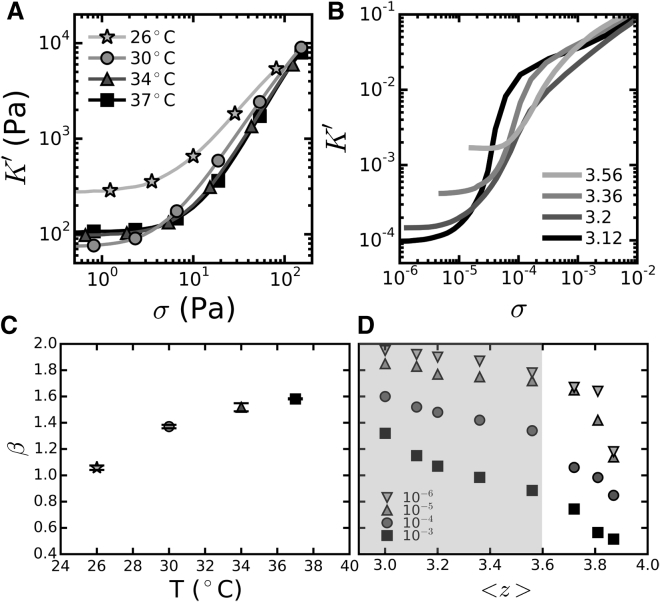
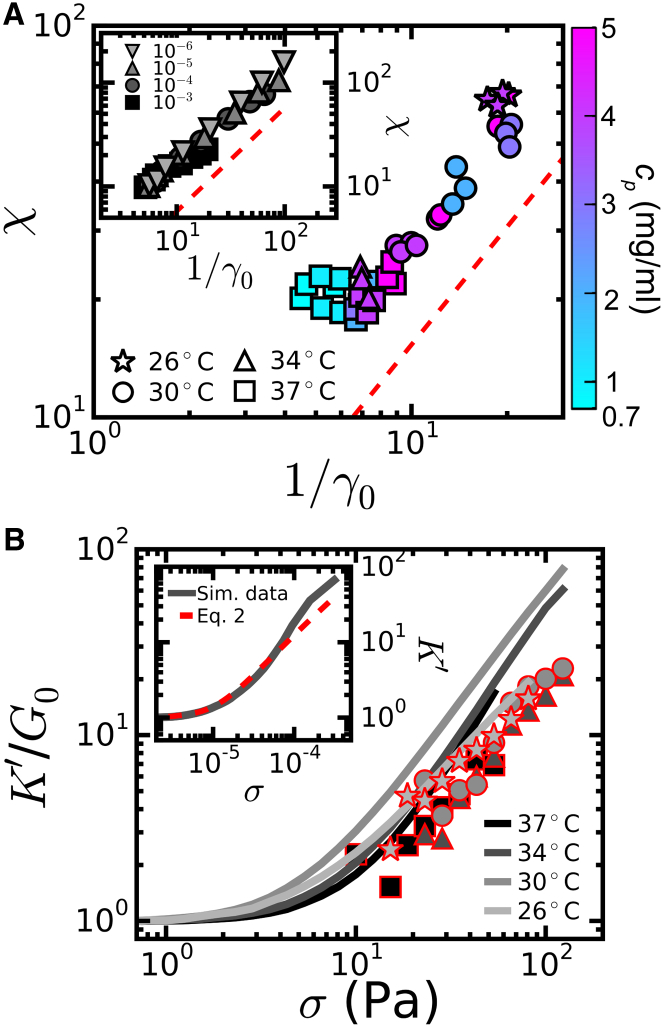
Collagen forms fibrous networks that reinforce tissues and provide an extracellular matrix for cells. These networks exhibit remarkable strain-stiffening properties that tailor the mechanical functions of tissues and regulate cell behavior. Recent models explain this nonlinear behavior as an intrinsic feature of disordered networks of stiff fibers. Here, we experimentally validate this theoretical framework by measuring the elastic properties of collagen networks over a wide range of self-assembly conditions. We show that the model allows us to quantitatively relate both the linear and nonlinear elastic behavior of collagen networks to their underlying architecture. Specifically, we identify the local coordination number (or connectivity) 〈z〉 as a key architectural parameter that governs the elastic response of collagen. The network elastic response reveals that 〈z〉 decreases from 3.5 to 3 as the polymerization temperature is raised from 26 to 37°C while being weakly dependent on concentration. We furthermore infer a Young's modulus of 1.1 MPa for the collagen fibrils from the linear modulus. Scanning electron microscopy confirms that 〈z〉 is between three and four but is unable to detect the subtle changes in 〈z〉 with polymerization conditions that rheology is sensitive to. Finally, we show that, consistent with the model, the initial stress-stiffening response of collagen networks is controlled by the negative normal stress that builds up under shear. Our work provides a predictive framework to facilitate future studies of the regulatory effect of extracellular matrix molecules on collagen mechanics. Moreover, our findings can aid mechanobiological studies of wound healing, fibrosis, and cancer metastasis, which require collagen matrices with tunable mechanical properties.


Figures

Figure 1
Figure 1
Temperature dependence of the microstructure of 4 mg/mL collagen networks. The temperature is indicated above each column in units of °C. Confocal reflection images (row 1), showing an open network of “fan-shaped” fibril bundles at 22°C and more homogeneous and progressively denser networks with increasing temperature, are given. SEM images are shown at two different magnifications (rows 2 and 3). The scale bars represent 20 μm (rows 1 and 2) and 200 nm (row 3). See Fig. S1 for additional data.
Figure 2
Figure 2
Comparison of fibril diameter measurements by electron microscopy on dried samples and turbidity measurements on hydrated samples. (A) Average fiber diameters for 4 mg/mL collagen networks polymerized at different temperatures, determined from SEM images (main graph) and turbidimetry (inset), are given. (B) The concentration dependence of the mass-length ratio obtained from turbidimetry for collagen networks formed at temperatures of 22° (triangles down), 26° (stars), 30 (circles), 34° (triangles up), and 37°C (squares) is given. The left y axis corresponds to the mass-length ratio μ, whereas the right y axis shows the corresponding number of monomers per fibril cross section, N (see Eq. S3). Turbidity data are averages ± SD for three samples per condition. SEM data are averages ± SD of three samples per condition, for which at least 250 fibrils were analyzed.
Figure 3
Figure 3
Comparison of the strain-stiffening response of collagen networks with simulations of disordered 2D fibrous networks. The differential elastic modulus K′ is plotted as a function of the applied shear strain, γ. Red symbols denote the onset strain at which stiffening sets in (γ0; see Fig. S5). Blue symbols denote the critical strain for the transition to stretch-dominated elasticity (γc; see Fig. S6). Data shown are representative examples measured on single networks. Symbols are shown for clarification only, and every fifth data point is shown. (A) The measurements for 4 mg/mL collagen networks polymerized at temperatures between 26 and 37°C are given (see legend). (B) Simulation data for 2D fibrous networks with a fixed dimensionless rigidity, κ˜=104, and varying average connectivity z are given (see legend). To see this figure in color, go online.
Figure 4
Figure 4
Comparison of the onset strain and the critical strain that characterize the strain-stiffening response of collagen networks with predictions for 2D fibrous networks. (A) Measurements of γ0 (open symbols) and γc (closed symbols) for 4 mg/mL collagen networks are given. Data points are averages ± SD for three samples per condition. (B) Corresponding simulation results are given showing the z -dependence of γ0 and γc for 2D networks with κ˜=104, a value that is representative of collagen networks at concentrations in the range of several mg/mL (25). The z -range relevant to the experiments is highlighted in gray. (C) The experiments (main plot) are in excellent agreement with the simulations (inset), which predict a power-law dependence of γ0 on γc with an exponent given by ϕf. The lines have slopes of 1.3 (main) and 1.1 (inset), based on predicted values of ϕ and f in Table S2. Data points represent individual measurements (at least three per condition) obtained at collagen concentrations cp between 0.7 and 5 mg/mL and polymerization temperatures between 26 and 37°C (see legends). To see this figure in color, go online.
Figure 5
Figure 5
Average connectivity z of collagen networks inferred from rheology data by calibrating measurements of γ0 with simulation data for 2D fibrous networks (see Fig. 4, A and B). (A) The concentration dependence of z at a polymerization temperature of 37°C (black squares) and 30°C (gray circles) is given. (B) The temperature dependence of z at a collagen concentration of 4 mg/mL is shown. Data points are averages ± SD for three samples per condition. The data are also tabulated in Table S1.
Figure 6
Figure 6
Comparison between measurements of the linear elastic modulus of collagen gels (closed symbols) and theoretical predictions for 3D fibrous networks (open symbols). The theoretical values are calculated according to Eq. 1, which takes as input z as inferred from the nonlinear rheology (Fig. 5; Table S1), the fiber mass length as measured by turbidimetry (Fig. 2), and the fiber Young’s modulus E as the sole fitting parameter. (A) The temperature dependence of G0 = G′ (0.5 Hz) for 4 mg/mL collagen gels is shown. (B) The concentration dependence of G0 for networks polymerized at 37°C and (C) 30°C is shown. The lines in (B) and (C) denote power-law fits with exponents of 2.6 and 2.1, respectively. Data points are averages ± SD for three samples per condition. The data are also tabulated in Table S1.
Figure 7
Figure 7
Comparison of the stress-stiffening response of collagen networks with predictions for 2D fibrous networks. (A) Example stiffening curves for 4 mg/mL collagen gels polymerized at different temperatures are given (see legend). The data shown are representative measurements on single networks. (B) Example stiffening curves for 2D fibrous networks with different connectivities z (see legend) and κ˜=104 (B) are given. (C) The stiffening exponent β, defined as the maximal slope of the stress-stiffening curves in the nonlinear regime, increases with temperature. Data points are averages ± SD for three samples per condition. (D) The simulations show that β depends on both κ˜ and z. The highlighted region depicts the z -range relevant to the experiments.
Figure 8
Figure 8
Sheared collagen networks develop a negative normal stress whose magnitude is linearly related to the nonlinear elastic modulus. (A) An example measurement is given, showing simultaneous stiffening (black line, left y axis) and the development of a negative normal stress (σN, right y axis) for a 4 mg/mL collagen network at 37°C. The inset shows a schematic side view of the cone-plate measurement geometry and indicates the directions of the shear stress σ and normal stress σN. (B) K increases linearly with σN for 4 mg/mL collagen gels polymerized at temperatures between 26 and 37°C (see legend). One representative measurement per temperature condition is plotted. The solid line shows the expected linear dependence from Eq. 2. To see this figure in color, go online.
Figure 9
Figure 9
The self-generated normal stress stabilizes collagen networks and controls the initial strain-stiffening response. (A) Both in experiments (main plot) and in simulations (inset), the susceptibility χ determined from stress-stiffening curves (symbols) is linear in 1/γ0 (dashed lines). Collagen gels were polymerized at temperatures between 26 and 37°C and collagen concentrations between 0.7 and 5 mg/mL (blue-pink) (see legend and color bar on the right). Simulations in the inset were performed for different κ˜ values (see legend) and for z between 3 and 3.87 (see Table S2). (B) The stress-stiffening response of 4 mg/mL collagen networks polymerized at temperatures ranging from 26 to 37°C is correctly predicted by Eq. 2 (red symbols, calculated using measurements of the normal stress as input) to within a factor of two. (B, inset) The simulations likewise show agreement between simulated K′ values (gray line) and calculations from the normal stress using Eq. 2 (red dashed line), as exemplified for a network with κ˜=104 and z=3.2. In (A), all individual measurements (at least three per conditions) are plotted, whereas in (B), representative curves are shown. To see this figure in color, go online.

References

    1. Fratzl P., editor. Collagen Structure and Mechanics. Springer Science+Business Media; Berlin, Germany: 2008.
    1. Kjaer M., Langberg H., Magnusson S.P. From mechanical loading to collagen synthesis, structural changes and function in human tendon. Scand. J. Med. Sci. Sports. 2009;19:500–510. - PubMed
    1. Boote C., Kamma-Lorger C.S., Meek K.M. Quantification of collagen organization in the peripheral human cornea at micron-scale resolution. Biophys. J. 2011;101:33–42. - PMC - PubMed
    1. Mouw J.K., Ou G., Weaver V.M. Extracellular matrix assembly: a multiscale deconstruction. Nat. Rev. Mol. Cell Biol. 2014;15:771–785. - PMC - PubMed
    1. Kai F., Laklai H., Weaver V.M. force matters: biomechanical regulation of cell invasion and migration in disease. Trends Cell Biol. 2016;26:486–497. - PMC - PubMed

Publication types

LinkOut - more resources