. 2018 Jun 5;19(6):1678.
doi: 10.3390/ijms19061678.

Niemann-Pick Type C2 Protein Regulates Free Cholesterol Accumulation and Influences Hepatic Stellate Cell Proliferation and Mitochondrial Respiration Function

Affiliations

Niemann-Pick Type C2 Protein Regulates Free Cholesterol Accumulation and Influences Hepatic Stellate Cell Proliferation and Mitochondrial Respiration Function

Yuan-Hsi Wang et al. Int J Mol Sci. .

Abstract

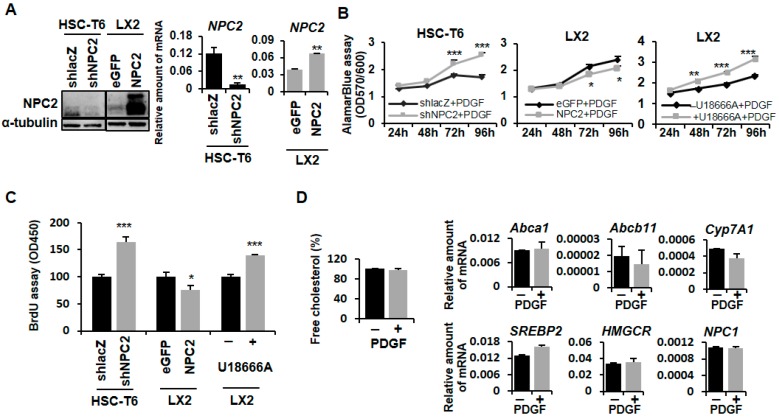
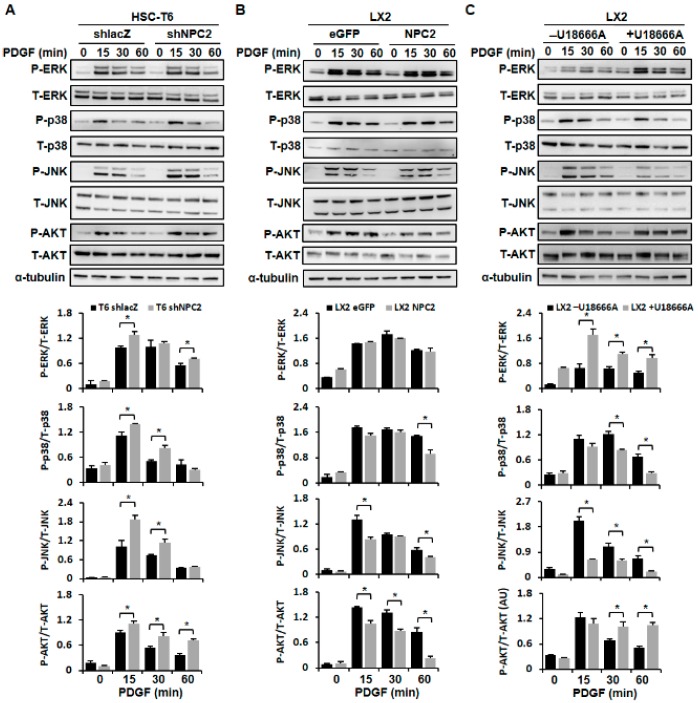
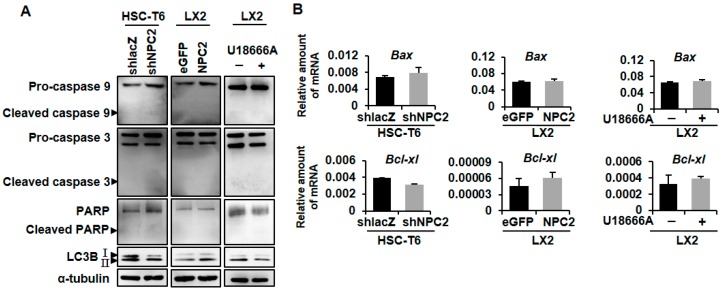
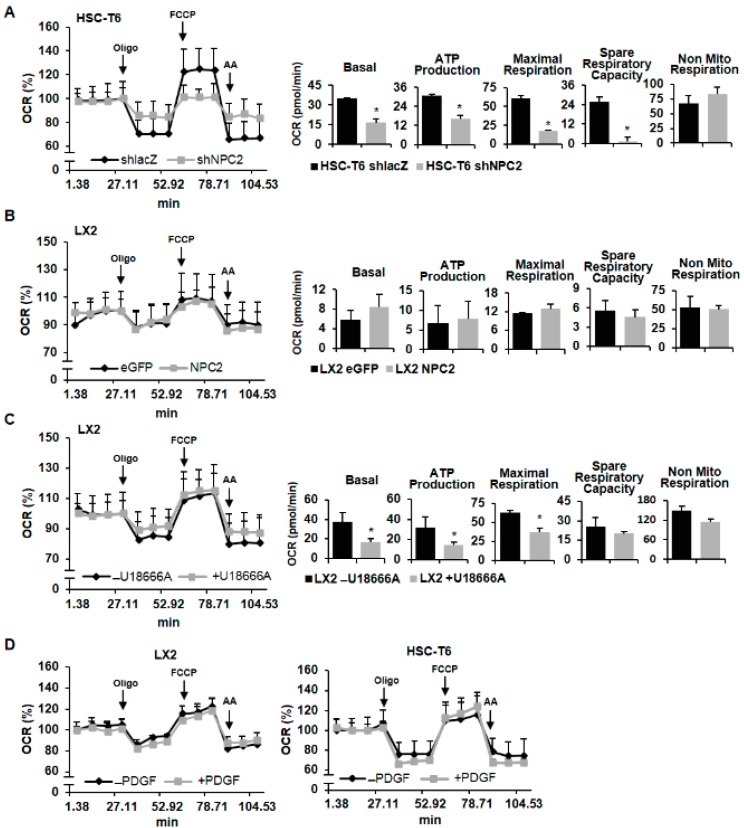
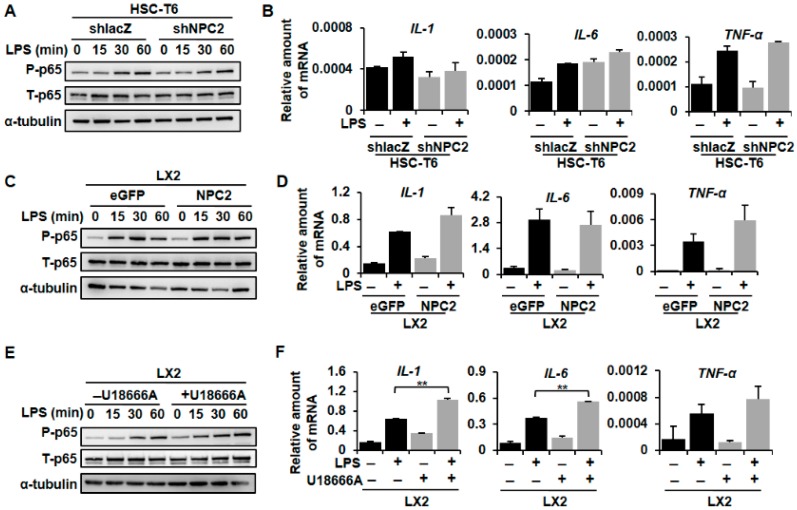
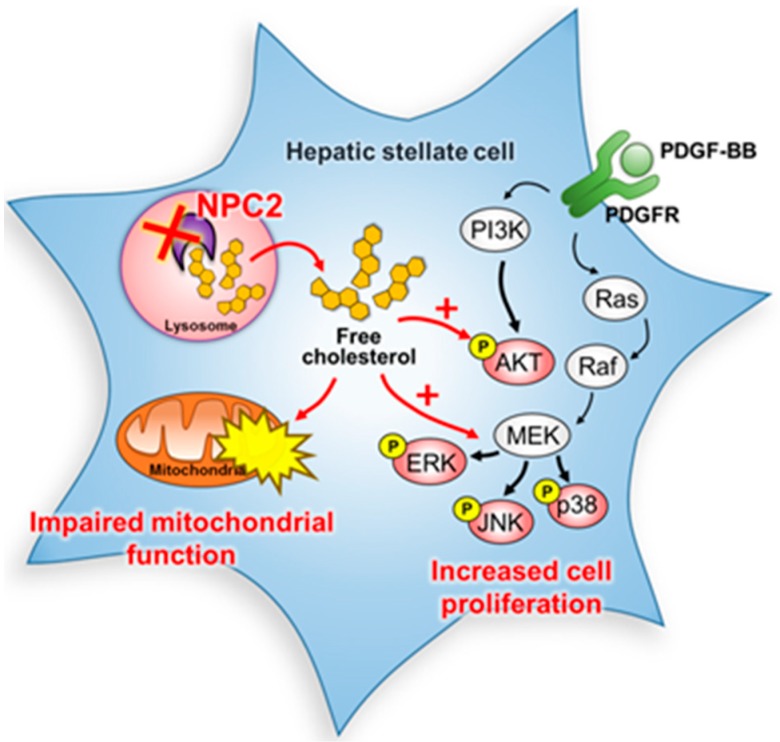
Liver fibrosis is the first step toward the progression to cirrhosis, portal hypertension, and hepatocellular carcinoma. A high-cholesterol diet is associated with liver fibrosis via the accumulation of free cholesterol in hepatic stellate cells (HSCs). Niemann-Pick type C2 (NPC2) plays an important role in the regulation of intracellular free cholesterol homeostasis via direct binding with free cholesterol. Previously, we reported that NPC2 was downregulated in liver cirrhosis tissues. Loss of NPC2 enhanced the accumulation of free cholesterol in HSCs and made them more susceptible to transforming growth factor (TGF)-β1. In this study, we showed that knockdown of NPC2 resulted in marked increases in platelet-derived growth factor BB (PDGF-BB)-induced HSC proliferation through enhanced extracellular signal-regulated kinases (ERK), p38, c-Jun N-terminal kinases (JNK), and protein kinase B (AKT) phosphorylation. In contrast, NPC2 overexpression decreased PDGF-BB-induced cell proliferation by inhibiting p38, JNK, and AKT phosphorylation. Although NPC2 expression did not affect caspase-related apoptosis, the autophagy marker light chain 3β (LC3B) was decreased in NPC2 knockdown, and free cholesterol accumulated in the HSCs. The mitochondrial respiration functions (such as oxygen consumption rate, ATP production, and maximal respiratory capacity) were decreased in NPC2 knockdown, and free cholesterol accumulated in the HSCs, while NPC2-overexpressed cells remained normal. In addition, NPC2 expression did not affect the susceptibility of HSCs to lipopolysaccharides (LPS), and U18666A treatment induced free cholesterol accumulation, which enhanced LPS-induced Toll-like receptor 4 (TLR4), nuclear factor kappa-light-chain-enhancer of activated B cells (NF-κB) p65 phosphorylation, interleukin (IL)-1 and IL-6 expression. Our study demonstrated that NPC2-mediated free cholesterol homeostasis controls HSC proliferation and mitochondrial function.

Keywords: Niemann-Pick type C2; free cholesterol; hepatic stellate cells; mitochondrial function; platelet-derived growth factor BB.


Conflict of interest statement

The authors declare no conflict of interest.

Figures

Figure 1
Figure 1
NPC2 downregulation induced free cholesterol accumulation which influenced PDGF-BB-induced cell proliferation in HSCs. (A) Western blot and real-time PCR were used to assess NPC2 gene expression in HSC-T6 shNPC2 and LX2 NPC2 stable cells; (B) Different lentiviruses infected HSC-T6 (shlacZ and shNPC2), LX2 (eGFP and NPC2) stable cells, and 1 µM U18666A pretreated LX2 cells were treated with 10 ng/mL PDGF-BB for the indicated time periods, and the cell viability was analyzed by adding 10 μL alamarBlue® reagent for 2.5 h and evaluating the absorbance at 570/600 nm; (C) Different lentiviruses infected HSC-T6 (shlacZ and shNPC2), LX2 (eGFP and NPC2) stable cells, and 1 µM U18666A pretreated LX2 cells were treated with 10 ng/mL PDGF-BB for 72 h, and the cell viability was analyzed by using the BrdU cell proliferation assay and evaluating the absorbance at 450 nm; (D) LX2 cells were treated with or without 10 ng/mL PDGF-BB overnight and then subjected to intracellular free cholesterol quantification. Real-time PCR was used to assess Abca1, Abcb11, Cyp7A1, sterol regulatory element-binding proteins (SREBP2), 3-hydroxy-3-methyl-glutaryl-coenzyme A reductase (HMGCR), and NPC1 in HSC-T6 cells. Data are shown as mean ± SD. * p < 0.05; ** p < 0.01; *** p < 0.001 vs. black line/bar. Each experiment was performed using three independent replicates with similar results.
Figure 2
Figure 2
NPC2 downregulation and free cholesterol accumulation in the HSC-enhanced PDGF-BB-initiated MAPK and AKT signaling pathway activation. (A) shlacZ and shNPC2 HSC-T6 stable cells; (B) eGFP and NPC2 LX2 stable cells were treated with 10 ng/mL PDGF-BB for 0, 15, 30, and 60 minutes, and the cell lysates were subjected to Western blot analysis to detect ERK, p38, JNK, and AKT phosphorylation; (C) LX2 cells were pretreated with or without 1 µM U18666A for 24 h and added to 10 ng/mL PDGF-BB for the indicated time periods, and the lysates were immunoblotted to detect ERK, p38, JNK, and AKT phosphorylation. Each experiment was performed using three independent replicates with similar results, and representative data are shown in the figure. The quantification of the figure was presented below by using the ImageJ system. Data are shown as mean ± SD. * p < 0.05 vs. black bar.
Figure 3
Figure 3
NPC2 expression and free cholesterol accumulation were not involved in the regulation of HSC apoptosis. (A) Protein expression of cleaved caspase 9, full caspase 9, cleaved caspase 3, full caspase 3, cleaved PARP, full PARP, LC3B, and α-tubulin was analyzed by using immunoblotting in NPC2-downregulated HSC-T6, NPC2-overexpressed LX2 and U18666A-treated LX2 cells; (B) Gene expression of pro-apoptotic Bax and anti-apoptotic Bcl-xl was analyzed by using real-time PCR in NPC2-downregulated HSC-T6 cells, NPC2-overexpressed LX2 cells, and U18666A-treated LX2 cells. Data are shown as mean ± SD. Each experiment was performed using three independent replicates. A similar phenomenon was observed, and representative data are shown in the figure.
Figure 4
Figure 4
Downregulating NPC2 expression and accumulating free cholesterol in HSCs caused mitochondrial function disruption. (A,B) Mitochondrial respiration functions of NPC2-downregulated and -overexpressed cells were analyzed by a Seahorse XFe extracellular flux analyzer. A quantity of 1 μM oligomycin, 2 μM FCCP, and 0.5 μM rotenene/antimycin A was injected into the well at the 4th, 8th, and 11th time point. Quantitative data are shown in the right panel. (C) LX2 cells were pretreated with or without 1 µM U18666A for 24 h, and the oxygen consumption rate was analyzed by a Seahorse XFe extracellular flux analyzer. (D) LX2 and HSC-T6 cells were pretreated with or without 10 ng/mL PDGF-BB overnight and then subjected to the Seahorse XFe extracellular flux analyzer to analyze the mitochondrial respiration functions. Data are shown as mean ± SD. * p < 0.05 vs. black bar.
Figure 5
Figure 5
NPC2 expression did not alter the LPS-induced inflammatory response, while U18666A-treated HSCs amplified LPS-induced inflammation. (A) HSC-T6 shlacZ and shNPC2 stable cells were treated with 100 ng/mL LPS for the indicated time periods, and the lysates were subjected to Western blot analysis and detect p65 phosphorylation; (B) HSC-T6 shlacZ and shNPC2 cells were pretreated with 100 ng/mL LPS for 3 h, and mRNA expression of IL-1, IL-6, and TNF-α was analyzed using real-time PCR; (C) LX2 eGFP and NPC2 stable cells were treated with 10 ng/mL LPS for the indicated time periods, and the lysates were immunoblotted and then quantified to detect p65 phosphorylation; (D) Real-Time PCR was used to analyze mRNA expression of LPS-induced IL-1, IL-6, and TNF-α. (E,F) LX2 cells were pretreated with or without 1 µM U18666A overnight to induce free cholesterol accumulation and then treated with 100 ng/mL LPS. Cell lysates were immunoblotted to detect p65 phosphorylation, while real-time PCR was used to analyze mRNA expression of LPS-induced IL-1, IL-6, and TNF-α; (G) Protein expression of TLR4 and α-tubulin was analyzed by using immunoblotting in NPC2-downregulated HSC-T6, NPC2-overexpressed LX2, and U18666A-treated LX2 cells. Data are shown as mean ± SD. ** p < 0.01 vs. black bar. Each experiment was performed using three independent replicates. A similar phenomenon was observed. Therefore, representative data are shown in the figure.
Figure 5
Figure 5
NPC2 expression did not alter the LPS-induced inflammatory response, while U18666A-treated HSCs amplified LPS-induced inflammation. (A) HSC-T6 shlacZ and shNPC2 stable cells were treated with 100 ng/mL LPS for the indicated time periods, and the lysates were subjected to Western blot analysis and detect p65 phosphorylation; (B) HSC-T6 shlacZ and shNPC2 cells were pretreated with 100 ng/mL LPS for 3 h, and mRNA expression of IL-1, IL-6, and TNF-α was analyzed using real-time PCR; (C) LX2 eGFP and NPC2 stable cells were treated with 10 ng/mL LPS for the indicated time periods, and the lysates were immunoblotted and then quantified to detect p65 phosphorylation; (D) Real-Time PCR was used to analyze mRNA expression of LPS-induced IL-1, IL-6, and TNF-α. (E,F) LX2 cells were pretreated with or without 1 µM U18666A overnight to induce free cholesterol accumulation and then treated with 100 ng/mL LPS. Cell lysates were immunoblotted to detect p65 phosphorylation, while real-time PCR was used to analyze mRNA expression of LPS-induced IL-1, IL-6, and TNF-α; (G) Protein expression of TLR4 and α-tubulin was analyzed by using immunoblotting in NPC2-downregulated HSC-T6, NPC2-overexpressed LX2, and U18666A-treated LX2 cells. Data are shown as mean ± SD. ** p < 0.01 vs. black bar. Each experiment was performed using three independent replicates. A similar phenomenon was observed. Therefore, representative data are shown in the figure.
Figure 6
Figure 6
Schematic diagram of the signaling pathways involved in the downregulation of NPC2 in HSCs. Knockdown NPC2 in HSCs resulted in free cholesterol accumulation and enhanced the PDGF-BB-induced HSC proliferation by increasing the downstream proteins of MAPK and AKT phosphorylation. In addition, the mitochondrial respiration function was also impaired. ×, NPC2 downregulation. Black arrows, pathway signals. Red arrows and plus sign, proposed signals.

Similar articles

Cited by

References

    1. Pellicoro A., Ramachandran P., Iredale J.P., Fallowfield J.A. Liver fibrosis and repair: Immune regulation of wound healing in a solid organ. Nat. Rev. Immunol. 2014;14:181–194. doi: 10.1038/nri3623. - DOI - PubMed
    1. Bataller R., Brenner D.A. Liver fibrosis. J. Clin. Invest. 2005;115:209–218. doi: 10.1172/JCI24282. - DOI - PMC - PubMed
    1. Geerts A. History, heterogeneity, developmental biology, and functions of quiescent hepatic stellate cells. Semin. Liver Dis. 2001;21:311–335. doi: 10.1055/s-2001-17550. - DOI - PubMed
    1. Carson J.P., Ramm G.A., Robinson M.W., McManus D.P., Gobert G.N. Schistosome-induced fibrotic disease: The role of hepatic stellate cells. Trends Parasitol. 2018;34:524–540. doi: 10.1016/j.pt.2018.02.005. - DOI - PubMed
    1. Moreira R.K. Hepatic stellate cells and liver fibrosis. Arch. Pathol. Lab. Med. 2007;131:1728–1734. - PubMed

MeSH terms