. 2018 Jun 6:361:k2130.
doi: 10.1136/bmj.k2130.

Clinical trial design and dissemination: comprehensive analysis of clinicaltrials.gov and PubMed data since 2005

Affiliations

Clinical trial design and dissemination: comprehensive analysis of clinicaltrials.gov and PubMed data since 2005

Magdalena Zwierzyna et al. BMJ. .

Abstract

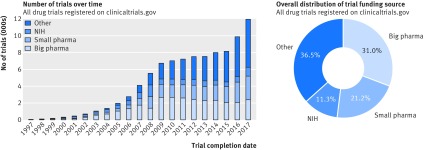
Objective: To investigate the distribution, design characteristics, and dissemination of clinical trials by funding organisation and medical specialty.

Design: Cross sectional descriptive analysis.

Data sources: Trial protocol information from clinicaltrials.gov, metadata of journal articles in which trial results were published (PubMed), and quality metrics of associated journals from SCImago Journal and Country Rank database.

Selection criteria: All 45 620 clinical trials evaluating small molecule therapeutics, biological drugs, adjuvants, and vaccines, completed after January 2006 and before July 2015, including randomised controlled trials and non-randomised studies across all clinical phases.

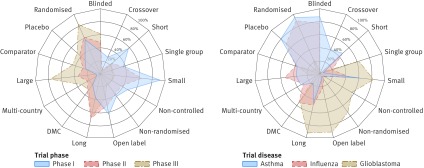
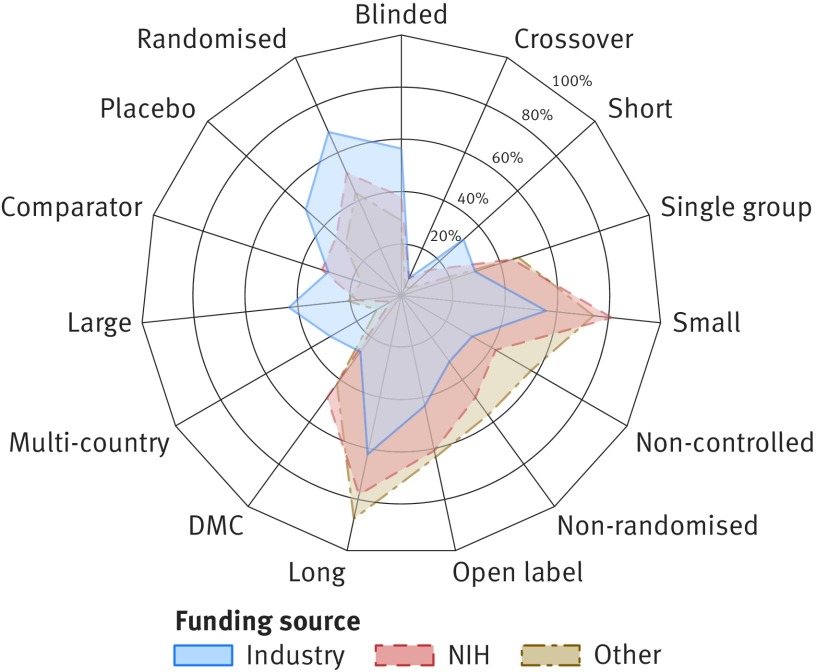
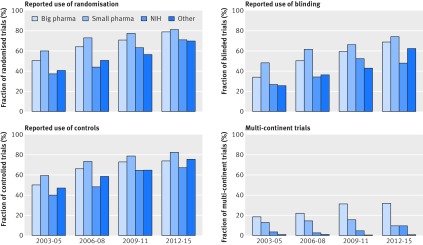
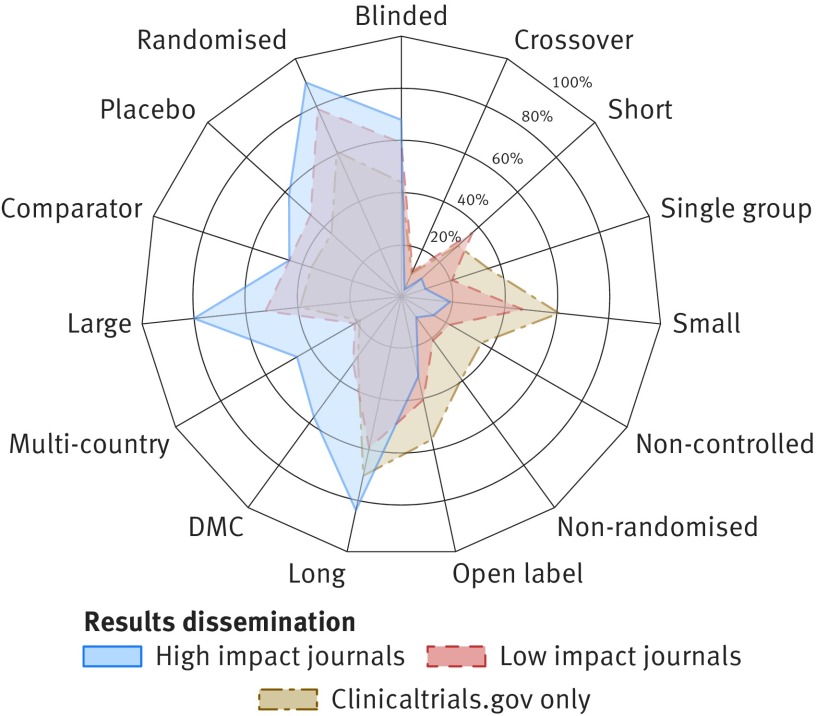
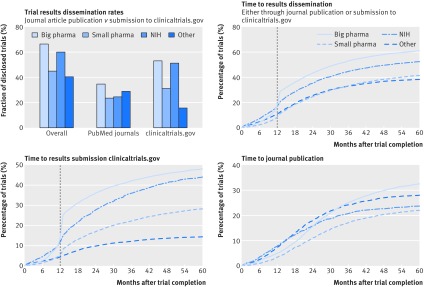
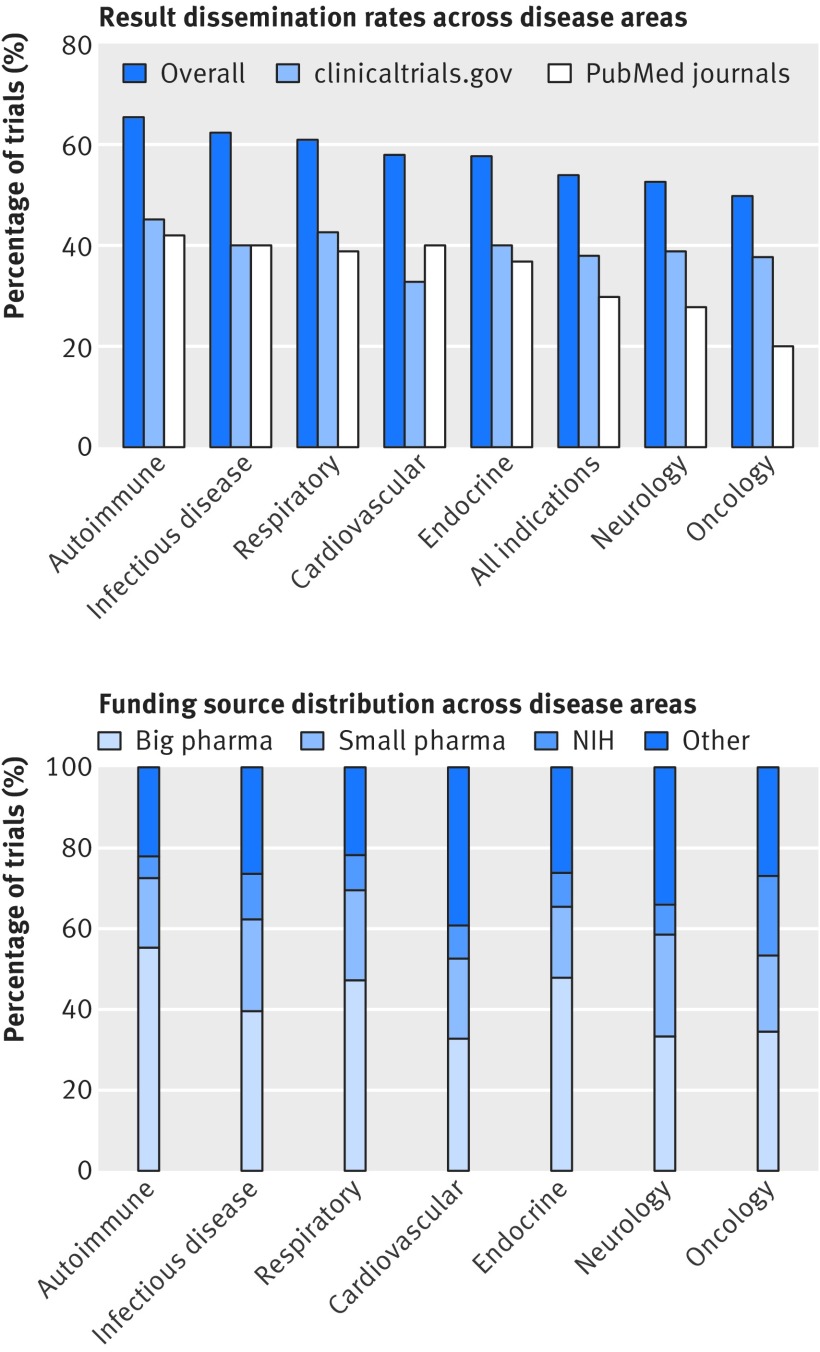
Results: Industry was more likely than non-profit funders to fund large international randomised controlled trials, although methodological differences have been decreasing with time. Among 27 835 completed efficacy trials (phase II-IV), 15 084 (54.2%) had disclosed their findings publicly. Industry was more likely than non-profit trial funders to disseminate trial results (59.3% (10 444/17 627) v 45.3% (4555/10 066)), and large drug companies had higher disclosure rates than small ones (66.7% (7681/11 508) v 45.2% (2763/6119)). Trials funded by the National Institutes of Health (NIH) were disseminated more often than those of other non-profit institutions (60.0% (1451/2417) v 40.6% (3104/7649)). Results of studies funded by large drug companies and NIH were more likely to appear on clinicaltrials.gov than were those from non-profit funders, which were published mainly as journal articles. Trials reporting the use of randomisation were more likely than non-randomised studies to be published in a journal article (6895/19 711 (34.9%) v 1408/7748 (18.2%)), and journal publication rates varied across disease areas, ranging from 42% for autoimmune diseases to 20% for oncology.

Conclusions: Trial design and dissemination of results vary substantially depending on the type and size of funding institution as well as the disease area under study.


Conflict of interest statement

Competing interests: All authors have completed the ICMJE uniform disclosure form at http://www.icmje.org/coi_disclosure.pdf (available on request from the corresponding author) and declare: no support from any organisation for the submitted work; no financial relationships with any organisations that might have an interest in the submitted work in the previous three years; no other relationships or activities that could appear to have influenced the submitted work.

Figures

Fig 1
Fig 1
Funding source distribution for all trials registered with clinicaltrials.gov. Left: trends in funding source distribution for all drug trials conducted after 1 Jan 1997 until 19 July 2017 (based on the start_date data field). Right: overall funding source distribution for all registered drug studies. NIH=National Institutes of Health
Fig 2
Fig 2
Trial design properties. Each radar chart illustrates differences between three groups of trials (represented by coloured polygons) with respect to 15 trial protocol characteristics (individual radial axes). Each axis shows fraction of trials with given property, such as reported use of randomisation, blinding, or data monitoring committees (DMC). Left: trial characteristics by clinical phase. Right: characteristics of phase II treatment oriented trials for three representative diseases. Profile of glioblastoma (with many small non-randomised studies) is typical of oncology trials; see supplementary file 2. NIH=National Institutes of Health
Fig 3
Fig 3
Phase II trial properties by funding source. Radar chart illustrates differences between three groups of trials (represented by coloured polygons) with respect to 15 trial protocol characteristics (individual radial axes). Axis shows fraction of trials with given property, such as reported use of randomisation, blinding, or data monitoring committees (DMC). Detailed statistics across four funding categories and remaining clinical phases are available in supplementary file 4. NIH=National Institutes of Health
Fig 4
Fig 4
Changes in clinical trial design over time. Plots compare characteristics of all phase II trials (regardless of completion status) divided into four temporal subsets based on their starting year. Additional results are available in supplementary file 2. NIH=National Institutes of Health
Fig 5
Fig 5
Characteristics of trials whose results were published as journal article or through direct submission to clinicaltrials.gov results database. Radar chart illustrates differences between three groups of trials (represented by coloured polygons) with respect to 15 trial protocol characteristics (individual radial axes). Axis shows fraction of trials with given property, such as reported use of randomisation, blinding, or data monitoring committees (DMC). Trials published as articles are divided into high and low impact classes based on 2016 H-index of corresponding journal (see Methods). Among 945 trials published in high impact journals (H-index >400), 459 (48.6%) were funded by big pharma, 178 by other organisations, 169 by small pharma, and 139 by National Institutes of Health. Detailed statistics available in supplementary file 3
Fig 6
Fig 6
Trial results dissemination rates by trial funding category. Top left: trial dissemination rates by funder type: overall dissemination rate, journal publications, and submission of structured results to clinicaltrials.gov. Top right: time to first results dissemination (whether through submission to clinicaltrials.gov results database or publication in journal article). Vertical line indicates 12 month deadline for reporting mandated by Food and Drug Administration Amendments Act. Bottom left: time to results reporting on clinicaltrials.gov. Bottom right: time to journal article publication. NIH=National Institutes of Health
Fig 7
Fig 7
Trial results dissemination rates and funding source distribution across seven medical specialties. Top: for each specialty, plot shows fraction of completed phase II-IV trials whose results were publicly disseminated, either as journal article or through direct submission to clinicaltrials.gov results database. Bottom: funding source distribution by medical specialty. NIH-National Institutes of Health

Similar articles

Cited by

References

    1. Sibbald B, Roland M. Understanding controlled trials. Why are randomised controlled trials important? BMJ 1998;316:201. 10.1136/bmj.316.7126.201 - DOI - PMC - PubMed
    1. Lindsay MA. Target discovery. Nat Rev Drug Discov 2003;2:831-8. 10.1038/nrd1202 - DOI - PubMed
    1. Sackett DL, Rosenberg WM, Gray JA, Haynes RB, Richardson WS. Evidence based medicine: what it is and what it isn’t. BMJ 1996;312:71-2. 10.1136/bmj.312.7023.71 - DOI - PMC - PubMed
    1. Woolf SH. The meaning of translational research and why it matters. JAMA 2008;299:211-3. 10.1001/jama.2007.26 - DOI - PubMed
    1. Kendall JM. Designing a research project: randomised controlled trials and their principles. Emerg Med J 2003;20:164-8. 10.1136/emj.20.2.164 - DOI - PMC - PubMed

Publication types

MeSH terms