. 2018 Jul;28(7):943-951.
doi: 10.1101/gr.230003.117. Epub 2018 Jun 6.

A model for postzygotic mosaicisms quantifies the allele fraction drift, mutation rate, and contribution to de novo mutations

Affiliations

A model for postzygotic mosaicisms quantifies the allele fraction drift, mutation rate, and contribution to de novo mutations

Adam Yongxin Ye et al. Genome Res. 2018 Jul.

Abstract

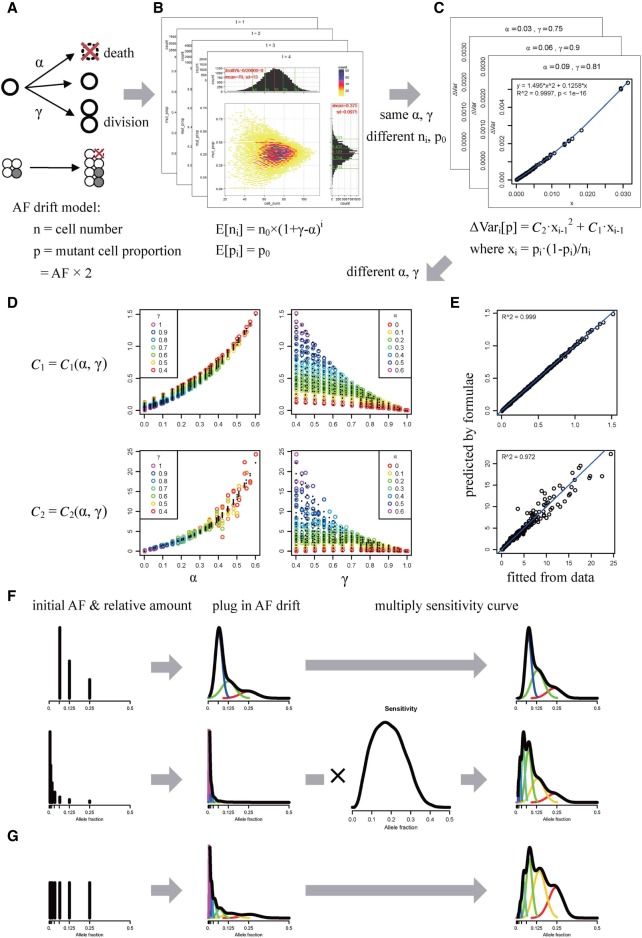
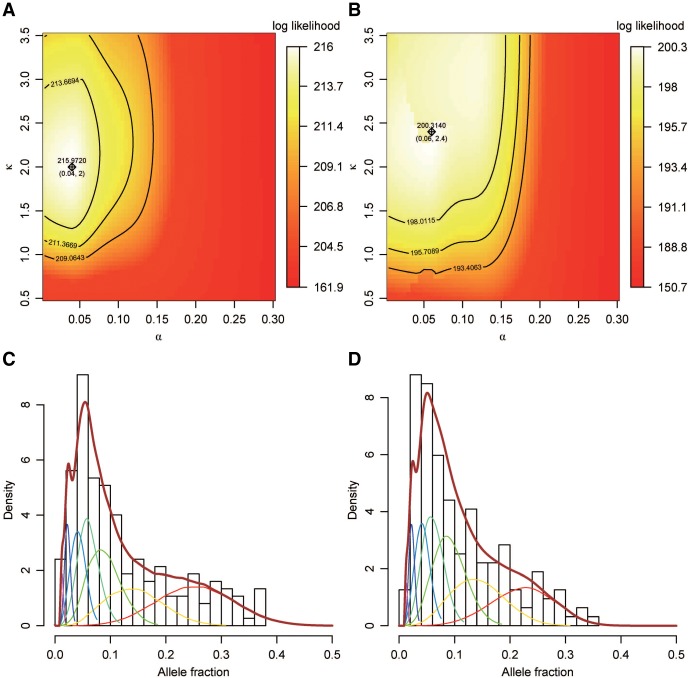
The allele fraction (AF) distribution, occurrence rate, and evolutionary contribution of postzygotic single-nucleotide mosaicisms (pSNMs) remain largely unknown. In this study, we developed a mathematical model to describe the accumulation and AF drift of pSNMs during the development of multicellular organisms. By applying the model, we quantitatively analyzed two large-scale data sets of pSNMs identified from human genomes. We found that the postzygotic mutation rate per cell division during early embryogenesis, especially during the first cell division, was higher than the average mutation rate in either male or female gametes. We estimated that the stochastic cell death rate per cell cleavage during human embryogenesis was ∼5%, and parental pSNMs occurring during the first three cell divisions contributed to ∼10% of the de novo mutations observed in children. We further demonstrated that the genomic profiles of pSNMs could be used to measure the divergence distance between tissues. Our results highlight the importance of pSNMs in estimating recurrence risk and clarified the quantitative relationship between postzygotic and de novo mutations.


Figures

Figure 1.
Figure 1.
Model describing the accumulation and allele fraction (AF) of postzygotic mosaicisms. (A) The extended Galton-Watson branching process for cell cleavage and AF drift. In each synchronized cleavage step, a cell could die with a probability α or divide with a probability γ. Mutant status (gray) is introduced for mosaicisms, summarized as mutation cell proportion (p) with cell number (n) as parameters. (B) The simulated joint distribution of cell number (ni, x-axis) and mutant cell proportion (pi, y-axis) after the i cleavage steps for each combination of initial parameters (α, γ, n0, and p0). (C) The quadratic regression of the increment of variance of mutant cell proportion ΔVari[p] = Var[pi] − Var[pi−1] = C2 · xi−12 + C1 · xi−1, where xi = pi · (1−pi)/ni, for each combination of α and γ. The blue curve shows the fitted quadratic regression. (D) The regression of the fitted coefficients C1 and C2 on the combination of α and γ. The colored circles are the sample points, and the black dots show the fitted values. Different colors indicate different γ in the plot with α as the x-axis and different α in the plot with γ as the x-axis. (E) The formulas C1(α, γ) and C2(α, γ) predict C1 and C2 well. The blue line is the diagonal line. (F,G) The expected positions of the initial AF and the relative amount for mosaicisms generated in each cleavage step, assuming a constant mutation rate for simple demonstration. (F) Theoretically, the relative ratio for naturally occurring mosaicisms should be proportional to the number of haploid genomes (similar to “exponential growth”). (G) If we consider parental mosaicisms present in one child as de novo mutations, the relative ratio for each cleavage step should stay as 1. The inner bell-shape curves with different colors show the components for different cleavage steps. Parameters were set as α = 0.05 and γ = 0.95, assuming no bottleneck and a constant mutation rate, for demonstration.
Figure 2.
Figure 2.
Maximum likelihood estimation (MLE) of cell death rate (α) and relative mutation rate ratio (κ) with the observed AF distribution. (A,B) Contour plots of the likelihood of our model fitted on the (A) WES and (B) WGS data sets. The x-axis denotes the death rate (α), and the y-axis denotes the relative ratio of the mutation rate between first division and latter divisions (κ). The MLEs of α and κ and the corresponding log likelihood are labeled with a cross. The curves from inside to outside show 10%, 1%, and 0.1% likelihood intervals, respectively. Aside from α and κ, the division rate (γ) is free to change, whereas the other parameters “mut steps,” “death from,” “bottleneck at,” bottleneck α, and bottleneck γ are set to 7, 3, 6, 0.5, and 0.5, respectively (Supplemental Table S1; Supplemental Methods). (C,D) Histogram of the AF distributions observed in the (C) WES and (D) WGS data sets. The thick brown curves denote the MLE-fitted, observed AF distribution with α = 0.05, γ = 0.95, and κ = 2.15. The thin inner bell-shape curves with different colors denote the components for different cleavage steps.
Figure 3.
Figure 3.
Measuring inter-tissue distance based on the AF similarity of shared mosaicism. (A) The AF difference of shared mosaicisms in two tissues could be traced back to their most recent common ancestral cell population, but not to an earlier stage when the mosaicisms were generated. (B,C) Clustering trees based on the pairwise distance matrix estimated from the WGS data set for (B) males and (C) females. The bootstrapping values labeled on the internal branches show the bootstrap supporting percentage on the partition of that branch.

References

    1. Abyzov A, Tomasini L, Zhou B, Vasmatzis N, Coppola G, Amenduni M, Pattni R, Wilson M, Gerstein M, Weissman S, et al. 2017. One thousand somatic SNVs per skin fibroblast cell set baseline of mosaic mutational load with patterns that suggest proliferative origin. Genome Res 27: 512–523. - PMC - PubMed
    1. Acuna-Hidalgo R, Bo T, Kwint MP, van de Vorst M, Pinelli M, Veltman JA, Hoischen A, Vissers LE, Gilissen C. 2015. Post-zygotic point mutations are an underrecognized source of de novo genomic variation. Am J Hum Genet 97: 67–74. - PMC - PubMed
    1. Argani P, Walsh PC, Epstein JI. 1998. Analysis of the prostatic central zone in patients with unilateral absence of wolffian duct structures: further evidence of the mesodermal origin of the prostatic central zone. J Urol 160: 2126–2129. - PubMed
    1. Bernkopf M, Hunt D, Koelling N, Morgan T, Collins AL, Fairhurst J, Robertson SP, Douglas AGL, Goriely A. 2017. Quantification of transmission risk in a male patient with a FLNB mosaic mutation causing Larsen syndrome: implications for genetic counseling in postzygotic mosaicism cases. Hum Mutat 38: 1360–1364. - PMC - PubMed
    1. Campbell IM, Stewart JR, James RA, Lupski JR, Stankiewicz P, Olofsson P, Shaw CA. 2014. Parent of origin, mosaicism, and recurrence risk: probabilistic modeling explains the broken symmetry of transmission genetics. Am J Hum Genet 95: 345–359. - PMC - PubMed

Publication types

LinkOut - more resources