

The strength of the biodiversity-ecosystem function relationship depends on spatial scale
- PMID: 29875295
- PMCID: PMC6015867
- DOI: 10.1098/rspb.2018.0038
The strength of the biodiversity-ecosystem function relationship depends on spatial scale
Abstract
Our understanding of the relationship between biodiversity and ecosystem functioning (BEF) applies mainly to fine spatial scales. New research is required if we are to extend this knowledge to broader spatial scales that are relevant for conservation decisions. Here, we use simulations to examine conditions that generate scale dependence of the BEF relationship. We study scale by assessing how the BEF relationship (slope and R2) changes when habitat patches are spatially aggregated. We find three ways for the BEF relationship to be scale-dependent: (i) variation among local patches in local (α) diversity, (ii) spatial variation in the local BEF relationship and (iii) incomplete compositional turnover in species composition among patches. The first two cause the slope of the BEF relationship to increase moderately with spatial scale, reflecting nonlinear averaging of spatial variation in diversity or the BEF relationship. The third mechanism results in much stronger scale dependence, with the BEF relationship increasing in the rising portion of the species area relationship, but then decreasing as it saturates. An analysis of data from the Cedar Creek grassland BEF experiment revealed a positive but saturating slope of the relationship with scale. Overall, our findings suggest that the BEF relationship is likely to be scale dependent.
Keywords: Jensen's inequality; ecosystem functioning; nonlinear averaging; spatial scale; species richness; β-diversity.
© 2018 The Author(s).
Conflict of interest statement
We declare that we have no competing interests.
Figures
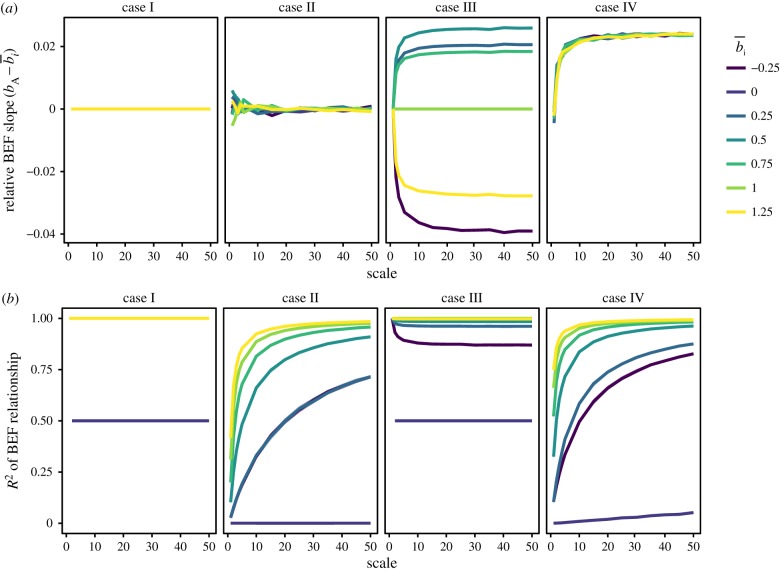
 , at different spatial scales (see electronic supplementary material, figure S1 for raw values of bA). Panel (b) shows the R2 of this relationship. The four cases are shown in the different panels—no variation in local species richness or local bi (case I), variation in local ai (case II), variation in local S (case III) or variation in local bi (case IV). The solid line shows the median across 100 replicate simulations each consisting of 2000 replicate regions at each scale. Inter-run variability omitted for clarity in panel (a), but shown in electronic supplementary material, figure S1. In panel (b), the interquartile range is smaller than the width of the lines and so is not shown. (Online version in colour.)
Similar articles
-
Scaling-up biodiversity-ecosystem functioning research.Ecol Lett. 2020 Apr;23(4):757-776. doi: 10.1111/ele.13456. Epub 2020 Jan 29. Ecol Lett. 2020. PMID: 31997566 Free PMC article. Review.
-
Biodiversity and ecosystem functioning in dynamic landscapes.Philos Trans R Soc Lond B Biol Sci. 2016 May 19;371(1694):20150267. doi: 10.1098/rstb.2015.0267. Philos Trans R Soc Lond B Biol Sci. 2016. PMID: 27114570 Free PMC article.
-
Beta diversity as a driver of forest biomass across spatial scales.Ecology. 2022 Oct;103(10):e3774. doi: 10.1002/ecy.3774. Epub 2022 Jul 15. Ecology. 2022. PMID: 35634996
-
The spatial sensitivity of the spectral diversity-biodiversity relationship: an experimental test in a prairie grassland.Ecol Appl. 2018 Mar;28(2):541-556. doi: 10.1002/eap.1669. Epub 2018 Feb 12. Ecol Appl. 2018. PMID: 29266500
-
Wetland habitats supporting waterbird diversity: Conservation perspective on biodiversity-ecosystem functioning relationship.J Environ Manage. 2024 Apr;357:120663. doi: 10.1016/j.jenvman.2024.120663. Epub 2024 Mar 28. J Environ Manage. 2024. PMID: 38552509 Review.
Cited by
-
A multitrophic perspective on biodiversity-ecosystem functioning research.Adv Ecol Res. 2019;61:1-54. doi: 10.1016/bs.aecr.2019.06.001. Epub 2019 Jul 23. Adv Ecol Res. 2019. PMID: 31908360 Free PMC article.
-
Scaling up biodiversity-ecosystem functioning relationships: the role of environmental heterogeneity in space and time.Proc Biol Sci. 2021 Mar 10;288(1946):20202779. doi: 10.1098/rspb.2020.2779. Epub 2021 Mar 10. Proc Biol Sci. 2021. PMID: 33715425 Free PMC article.
-
Remote spectral detection of biodiversity effects on forest biomass.Nat Ecol Evol. 2021 Jan;5(1):46-54. doi: 10.1038/s41559-020-01329-4. Epub 2020 Nov 2. Nat Ecol Evol. 2021. PMID: 33139920
-
Planktonic functional diversity changes in synchrony with lake ecosystem state.Glob Chang Biol. 2023 Feb;29(3):686-701. doi: 10.1111/gcb.16485. Epub 2022 Nov 12. Glob Chang Biol. 2023. PMID: 36370051 Free PMC article.
-
Long-term insect censuses capture progressive loss of ecosystem functioning in East Asia.Sci Adv. 2023 Feb 3;9(5):eade9341. doi: 10.1126/sciadv.ade9341. Epub 2023 Feb 3. Sci Adv. 2023. PMID: 36735783 Free PMC article.
References
-
- O'Connor MI, et al. 2017. A general biodiversity–function relationship is mediated by trophic level. Oikos 126, 18–31. (10.1111/oik.03652) - DOI
Publication types
MeSH terms
Associated data
Grants and funding
LinkOut - more resources
Full Text Sources
Other Literature Sources
