. 2018 Jun 7;3(11):e96544.
doi: 10.1172/jci.insight.96544.

Smooth muscle glucose metabolism promotes monocyte recruitment and atherosclerosis in a mouse model of metabolic syndrome

Affiliations

Smooth muscle glucose metabolism promotes monocyte recruitment and atherosclerosis in a mouse model of metabolic syndrome

Valerie Z Wall et al. JCI Insight. .

Abstract

Metabolic syndrome contributes to cardiovascular disease partly through systemic risk factors. However, local processes in the artery wall are becoming increasingly recognized to exacerbate atherosclerosis both in mice and humans. We show that arterial smooth muscle cell (SMC) glucose metabolism markedly synergizes with metabolic syndrome in accelerating atherosclerosis progression, using a low-density lipoprotein receptor-deficient mouse model. SMCs in proximity to atherosclerotic lesions express increased levels of the glucose transporter GLUT1. Cytokines, such as TNF-α produced by lesioned arteries, promote GLUT1 expression in SMCs, which in turn increases expression of the chemokine CCL2 through increased glycolysis and the polyol pathway. Furthermore, overexpression of GLUT1 in SMCs, but not in myeloid cells, accelerates development of larger, more advanced lesions in a mouse model of metabolic syndrome, which also exhibits elevated levels of circulating Ly6Chi monocytes expressing the CCL2 receptor CCR2. Accordingly, monocyte tracing experiments demonstrate that targeted SMC GLUT1 overexpression promotes Ly6Chi monocyte recruitment to lesions. Strikingly, SMC-targeted GLUT1 overexpression fails to accelerate atherosclerosis in mice that do not exhibit the metabolic syndrome phenotype or monocytosis. These results reveal a potentially novel mechanism whereby arterial smooth muscle glucose metabolism synergizes with metabolic syndrome to accelerate monocyte recruitment and atherosclerosis progression.

Keywords: Atherosclerosis; Glucose metabolism; Vascular Biology.


Conflict of interest statement

Conflict of interest: The authors have declared that no conflict of interest exists.

Figures

Figure 1
Figure 1. GLUT1 is increased in medial SMCs underlying lesions.
Representative advanced BCA lesion stained with a Movat’s pentachrome stain (A) and a SM α-actin antibody (B) after 22 weeks of DDC feeding. (C) Slc2a1 mRNA transcripts were quantified by in situ RNA hybridization in the medial SMCs beneath the lesion and compared with transcripts from medial SMCs at a nonatherosclerotic site opposite from the lesion in the same animals. Slc2a1-positive signals are indicated by arrows. (D) Slc2a1 mRNA is increased after a 24-hour stimulation with TNF-α (5 ng/ml) or IL-1β (5 ng/ml). (E) 2-Deoxyglucose (2-DOG) uptake is increased after 48-hour stimulation with 5 ng/ml TNF-α. Results are expressed as mean ± SEM (n = 4 in D and E). Statistical analysis was performed by 2-tailed paired (C) or unpaired (E) Student’s t test or 1-way ANOVA and Tukey’s post hoc tests (D); *P < 0.05; ***P < 0.001. IEL, internal elastic lamina.
Figure 2
Figure 2. SMC GLUT1 overexpression leads to increased glycolysis and accumulation of polyol pathway intermediates.
Aortic SMCs were isolated from Ldlr–/– SM-GLUT1 mice and littermate controls, and 2-DOG uptake (A) and lactate release (B) were measured. In other experiments, GLUT1 (Slc2a1) was overexpressed by a pBM retrovirus (C), leading to increased lactate release (D) and Txnip mRNA levels (E). Targeted metabolomics revealed that GLUT1 overexpression increased glucose levels (F) and the polyol pathway intermediates sorbitol (G) and glyceraldehyde (H). GLUT1 overexpression did not significantly increase glycosamine pathway intermediates (I). Results are expressed as mean ± SEM (n = 6 in A; n = 3 in B; n = 6 in C and E; n = 8 in D and F–I). Statistical analysis was performed by 2-tailed unpaired Student’s t test in A–E and unpaired t tests corrected for multiple comparisons using the Holm-Sidak method (adjusted q values are shown); *P < 0.05; ****P < 0.0001. (J) Schematic representation of the results of GLUT1 overexpression on SMC metabolism. Significantly increased metabolites are shown in blue, while nominally significantly increased metabolites are highlighted by italics.
Figure 3
Figure 3. DDC feeding in male and female Ldlr–/– mice results in dyslipidemia and features of metabolic syndrome, which are not affected by SMC GLUT1 overexpression.
(A) Male and female WT and SM-GLUT1 Ldlr–/– mice, 8–10 weeks of age, were fed DDC or chow for 16 weeks. DDC-fed male mice exhibited elevated plasma cholesterol (B), elevated plasma triglycerides (C), increased body weight (D), and elevated nonfasting blood glucose levels (E). (F) Glucose tolerance tests revealed impaired glucose tolerance. SM-GLUT1 overexpression did not affect any of these parameters. Results are expressed as mean ± SEM (n = 16–25 for groups in D and E, as shown in B and C; n = 10–16 in F). Female Ldlr–/– mice fed DDC develop similarly elevated plasma cholesterol (G) but exhibit a lesser degree of increased triglycerides (H), body weight gain (I), nonfasting blood glucose (J), and glucose intolerance (K), as compared with male mice. (L) HbA1c levels in male and female mice fed DDC. Results are expressed as mean ± SEM (n = 5–15 in GK, as shown in G). Statistical analysis was performed by 1-way ANOVA (B, C, G, H) or 2-way ANOVA (D–F, I–K) with Tukey’s post hoc test; *,#P < 0.05; **,##P < 0.01; ***,###P < 0.001; ****,####P < 0.0001, where * indicates WT and # indicates SM-GLUT1 chow vs. DDC in D–F and I–K.
Figure 4
Figure 4. Smooth muscle–targeted GLUT1 overexpression enhances aortic lesion size and complexity in DDC-fed mice.
(A) SM-GLUT1 mice fed DDC exhibit larger aortic lesions. Lipids extracted from the whole aorta revealed greater cholesterol content (B) in SM-GLUT1 mice fed DDC. Free cholesterol (C) accounted for the increase, whereas cholesteryl esters (CE) (D) were raised by DDC feeding alone. Gene expression was measured by real-time PCR in homogenized whole aortas: Abca1 (E), Cxcl1 (F), Cd11b (G), Cnn1 (H), Has1 (I), and Has3 (J). Results are expressed as mean ± SEM (A–D, n = 21–36, as shown in A; E–J, n = 15–21 as shown in E). One mouse in the SM-GLUT1 DDC group was excluded as a statistical outlier based on Grubb’s test. Statistical analysis was performed by 1-way ANOVA with Tukey’s post hoc test; *P < 0.05; **P < 0.01; ***P < 0.001; ****P < 0.0001.
Figure 5
Figure 5. Smooth muscle–targeted GLUT1 overexpression increases BCA lesion size and complexity in DDC-fed mice.
BCA lesion morphology (A and B) was assessed in serial sectioned BCAs stained by the Movat’s pentachrome stain. Arrow indicates a necrotic core in a BCA from a DDC-fed SM-GLUT1 mouse. BCA morphology was assessed in all chow-fed mice and in DDC-fed mice with plasma cholesterol levels above 1,000 mg/dl. BCA maximal lesion area (C), medial area (D), Mac-2–positive lesion area (E), and SM α-actin–positive lesion area (F). (G) Representative lesion cross-sections adjacent to the maximal lesion site stained for Mac-2 and SM α-actin. (H) Representative lesion from a DDC-fed SM-GLUT1 mouse showing intraplaque hemorrhage. Frequency of necrotic cores (I) and intraplaque hemorrhage (J). Results are expressed as mean ± SEM (n = 15–23). Statistical analysis was performed by 1-way ANOVA with Tukey’s post hoc tests or by Kruskal-Wallis test with Dunn’s post hoc tests (I and J). One animal was excluded from the SM-GLUT1 chow group as a statistical outlier by Grubbs’ test. *P < 0.05; **P < 0.01; ***P < 0.001; ****P < 0.0001. Scale bars: 100 μm
Figure 6
Figure 6. Neither GLUT1 overexpression in myeloid cells nor smooth muscle–targeted GLUT1 overexpression in low-fat diet–fed mice increases atherosclerosis.
CD68-GLUT1 overexpressing male Ldlr–/– mice (A) exhibited increased 2-DOG uptake (B) and lactate release (C) in BM-derived macrophages, versus littermate controls (n = 9 in B; n = 6 in C). Myeloid cell GLUT1 overexpression did not affect aortic atherosclerosis (D), plasma cholesterol (E), triglycerides (F), glucose intolerance (G), or body weight (H). Results are expressed as mean ± SEM. Female Ldlr–/– SM-GLUT1 mice and littermate controls were fed a low-fat semipurified diet (LFD) for 12–32 weeks. Plasma cholesterol (I), triglycerides (J), and body weight (K) were lower than in DDC-fed mice. Mice exhibited aortic lesions, but SM-GLUT1 had no effect (L). (M and N) BCA lesions were advanced, with necrotic cores (black arrows) and fibrotic areas (white arrows). Results are expressed as mean ± SEM. Statistical analysis was performed by 1-way ANOVA (B, C, E, F); 2-way ANOVA (G, H, K) with Tukey’s post hoc test; *,#P < 0.05; **,##P < 0.01; ***,###P < 0.001; ****,####P < 0.0001, where * indicates WT and # indicates SM-GLUT1 in G and H. BMT, bone marrow transplant; LFD, low-fat diet.
Figure 7
Figure 7. GLUT1 overexpression synergizes with TNF-α to promote CCL2 and TNF-α production in aortic SMCs.
(A and B) Aortas from SM-GLUT1 mice exhibit increased expression of Tnfa and Ccl2 mRNA (n = 15 for WT chow and SM-GLUT1 chow groups; n = 14 for WT DDC group; n = 21 for SM-GLUT1 DDC group). Mouse aortic SMCs transduced with a retrovirus to overexpress GLUT1, or the empty pBM virus as control, were stimulated with mouse recombinant TNF-α (5 ng/ml) for 1 hour (C) or 24 hours (D–I). Tnfa (C) and Ccl2 mRNA (D, F, G) were measured by real-time PCR. TNF-α–driven Ccl2 mRNA and CCL2 secretion, measured by ELISA, in SMCs was increased by GLUT1 overexpression (D and E). TNF-α induction of Ccl2 mRNA levels is prevented by inhibiting glycolysis by incubation of the cells in the presence of 1 mM 2-DOG (F) or by inhibiting aldose reductase by 2 different inhibitors (zopolrestat [zopol] or tolrestat [tol]) in the polyol pathway (G). (H) TNF-α–induced suppression of Slc16a4 was not altered by aldose reductase inhibitors. (I) TNF-α–induced Slc2a1 was not altered by aldose reductase inhibitors. Results are expressed as mean ± SEM (n = 3 in C; n = 6 in D–F; n = 3–4 in G–I). Statistical analysis was performed by 1-way ANOVA with Tukey’s post hoc test; *P < 0.05; **P < 0.001; ****P < 0.0001.
Figure 8
Figure 8. SMC GLUT1 promotes monocyte recruitment in vivo.
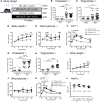
(A) Study design. WT and SM-GLUT1 mice were fed DDC for 16 weeks before monocytes were depleted with clodronate liposomes (Clod. lip). Sixteen hours after clodronate injection, yellow-green (YG) microparticles were injected retro-orbitally to label newly formed monocytes (predominantly Ly6Chi monocytes). Three days after YG-bead injection, labeling efficiency was determined by flow cytometry. The experiment was terminated 4 days after labeling. (B) Flow cytometric analysis of the level of depletion of monocytes in the blood (>98%) in a Clod. lip–injected mouse compared with noninjected mouse. (C) Flow cytometric analysis of labeling efficiency in the circulation in a Clod. lip– and YG-bead–injected mouse compared with mouse not injected with Clod. lip or YG-beads. (D) Labeling efficiency as % of total monocytes (Ly6Chi monocytes constitutes >80% of all monocytes 4 days after depletion), and as % of total CD45+ cells. (E) Representative images from brachiocephalic artery (BCA). Green, YG-beads (white arrows) and elastic lamina; red, Mac-2 (macrophages); blue, DAPI (nuclei). (F) Quantification of YG-beads/BCA with and without normalizing to percent of labeled monocytes. n = 11–17. Statistical analysis was performed by 2-tailed unpaired Student’s t test. *P < 0.05; **P < 0.01.
Figure 9
Figure 9. Mechanistic model.
The metabolic syndrome phenotype results in monocytosis and increased numbers of circulating CCR2-positive Ly6Chi monocytes. These monocytes are recruited to forming lesions of atherosclerosis. In the lesion, monocytes and mature macrophages secrete cytokines, including TNF-α. TNF-α, in turn, acts on adjacent SMCs to induce GLUT1 and the chemokine CCL2. Increased GLUT1 stimulates glycolysis and the polyol pathway in the SMCs. The polyol pathway, through aldose reductase, enhances TNF-α–induced CCL2 expression and secretion. SMC-derived CCL2 further stimulates Ly6Chi monocyte recruitment to the lesion, creating a cycle driving lesion progression in the setting of metabolic syndrome. EC, endothelial cell; TNFR, TNF receptor.

Similar articles

Cited by

References

    1. Silverman MG, et al. Association Between Lowering LDL-C and Cardiovascular Risk Reduction Among Different Therapeutic Interventions: A Systematic Review and Meta-analysis. JAMA. 2016;316(12):1289–1297. doi: 10.1001/jama.2016.13985. - DOI - PubMed
    1. [No authors listed] Randomised trial of cholesterol lowering in 4444 patients with coronary heart disease: the Scandinavian Simvastatin Survival Study (4S) Lancet. 1994;344(8934):1383–1389. - PubMed
    1. Cannon CP, et al. Intensive versus moderate lipid lowering with statins after acute coronary syndromes. N Engl J Med. 2004;350(15):1495–1504. doi: 10.1056/NEJMoa040583. - DOI - PubMed
    1. Ray KK, et al. Early and late benefits of high-dose atorvastatin in patients with acute coronary syndromes: results from the PROVE IT-TIMI 22 trial. J Am Coll Cardiol. 2005;46(8):1405–1410. doi: 10.1016/j.jacc.2005.03.077. - DOI - PubMed
    1. Lee KH, et al. Benefit of early statin therapy in patients with acute myocardial infarction who have extremely low low-density lipoprotein cholesterol. J Am Coll Cardiol. 2011;58(16):1664–1671. doi: 10.1016/j.jacc.2011.05.057. - DOI - PubMed

Publication types

MeSH terms