. 2018 Jun 6;9(1):2192.
doi: 10.1038/s41467-018-04462-8.

SETBP1 induces transcription of a network of development genes by acting as an epigenetic hub

Affiliations

SETBP1 induces transcription of a network of development genes by acting as an epigenetic hub

Rocco Piazza et al. Nat Commun. .

Abstract

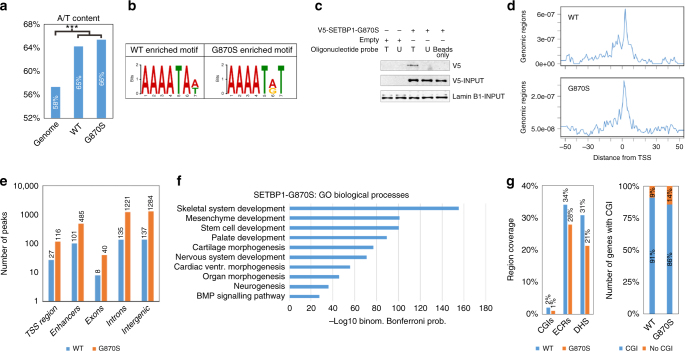
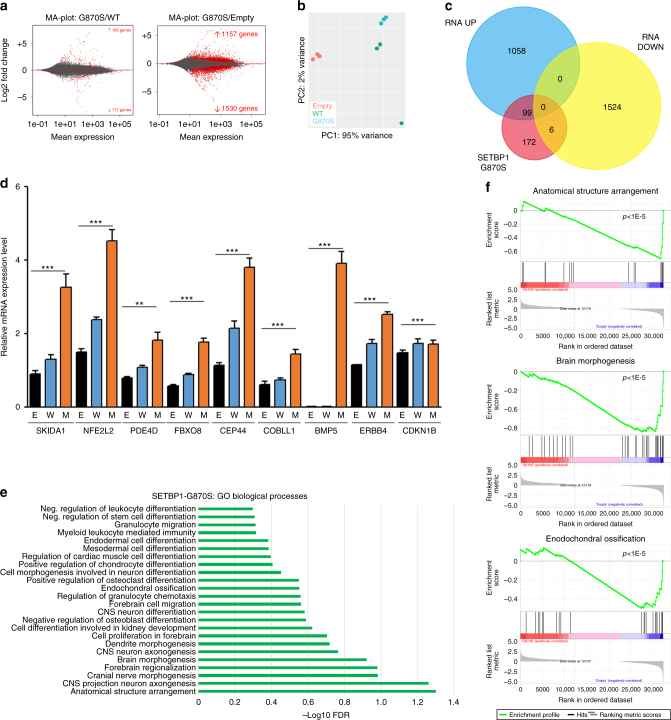
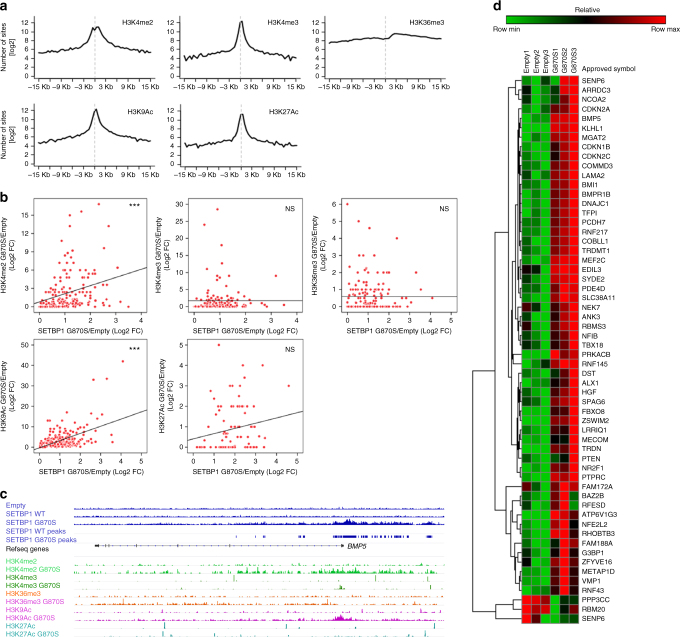
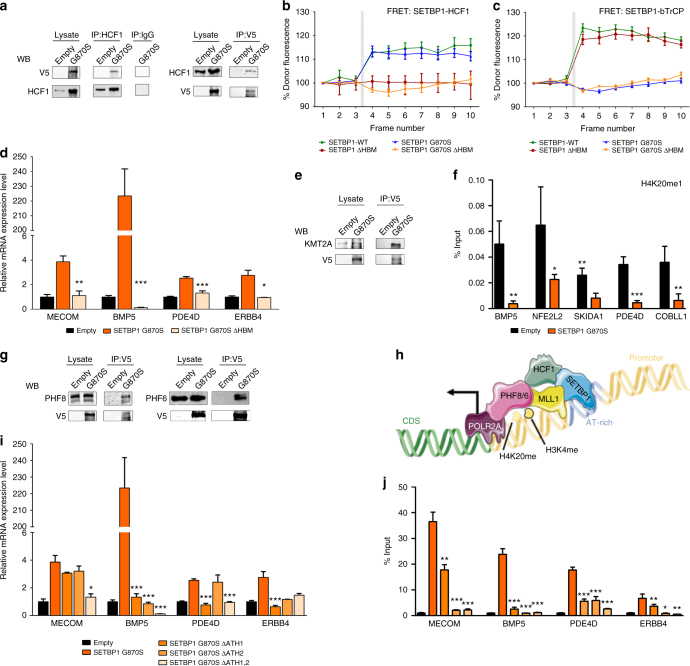
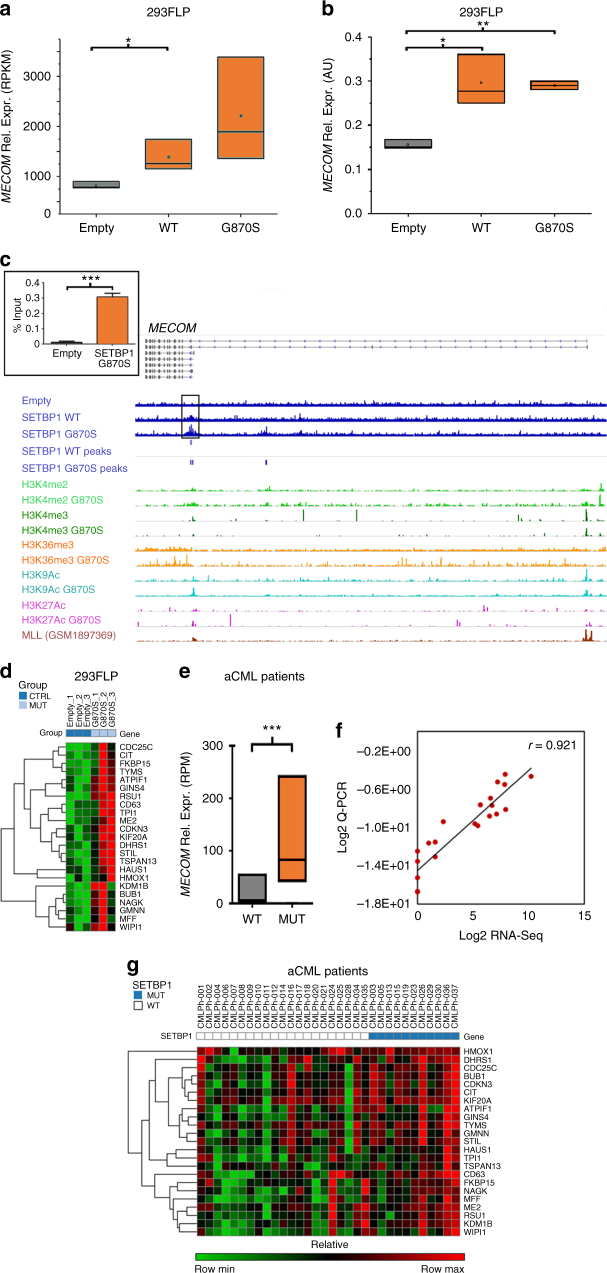
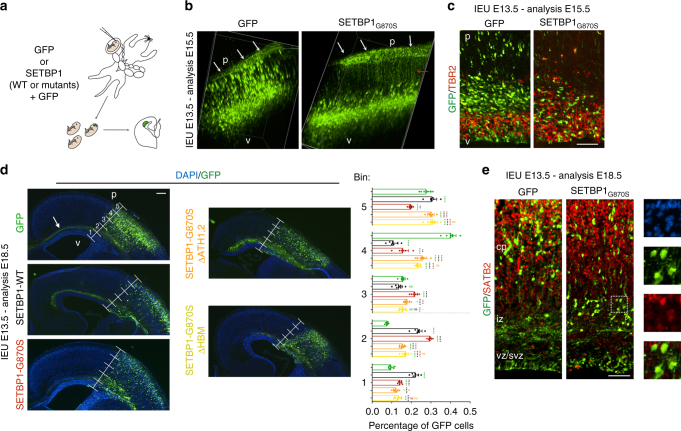
SETBP1 variants occur as somatic mutations in several hematological malignancies such as atypical chronic myeloid leukemia and as de novo germline mutations in the Schinzel-Giedion syndrome. Here we show that SETBP1 binds to gDNA in AT-rich promoter regions, causing activation of gene expression through recruitment of a HCF1/KMT2A/PHF8 epigenetic complex. Deletion of two AT-hooks abrogates the binding of SETBP1 to gDNA and impairs target gene upregulation. Genes controlled by SETBP1 such as MECOM are significantly upregulated in leukemias containing SETBP1 mutations. Gene ontology analysis of deregulated SETBP1 target genes indicates that they are also key controllers of visceral organ development and brain morphogenesis. In line with these findings, in utero brain electroporation of mutated SETBP1 causes impairment of mouse neurogenesis with a profound delay in neuronal migration. In summary, this work unveils a SETBP1 function that directly affects gene transcription and clarifies the mechanism operating in myeloid malignancies and in the Schinzel-Giedion syndrome caused by SETBP1 mutations.


Conflict of interest statement

The authors declare no competing interests.

Figures

Fig. 1
Fig. 1
Interaction of SETBP1 with genomic DNA. a A/T content comparison between SETBP1 WT/G870S-binding regions and the reference genome. The frequency of A/T in SETBP1 target regions was compared with A/T frequency in the entire genome. Pearson's chi-squared test was used to test the significance of the difference between the two proportions. Actual numbers can be found in Supplementary Table 1. b SETBP1 consensus binding site revealed by de novo motif discovery. c Nuclear cell lysate oligonucleotide pulldown experiment. Target (T) and non-target (U) biotinylated probe oligonucleotides were designed according to ChIP-Seq data. Empty beads were used as control for non-specific binding. Pulldown was performed on nuclear extract from FLP-In SETBP1-G870S transfectants or Empty lines. Lamin B1 was used as a loading control. d Peak distribution density according to the distance from gene transcription start sites. e Peak quantitation in the different genomic regions, reflecting the position of binding sites relative to the next known gene. f Gene Ontology (GO) biological process functional enrichment of SETBP1 target genes. g Left, percentage of WT and G870S regions covered by CpG islands (CGIs), evolutionary conserved regions (ECRs), and DNase I hypersensitivity (DHS) at single-nucleotide resolution. Right, percentage of SETBP1 target genes having CpG islands within their promoter. ***p < 0.001
Fig. 2
Fig. 2
Effect of SETBP1 G870S expression at the transcriptional level. a MA plot showing the expression data of SETBP1-G870S vs. SETBP1-WT (left) and SETBP1-G870S vs. Empty cells (right) as a function of log ratios (M) and mean average gene counts. b Variance distribution of 3 Empty, 3 SETBP1-WT, and 3 SETBP1-G870S clones emphasized by Principal Component Analysis 1 (PC1) showing 95% of total variance. c Venn diagram showing the number of differentially expressed genes being directly bound by SETBP1 within their promoter region (red circle). d Q-PCR analysis of a subset of SETBP1 DEGs identified by RNA-Seq: E (Empty), W (SETBP1_wt), M (SETBP1_G870S). The housekeeping gene GUSB was used as an internal reference. Experiments were performed in triplicate; statistical analysis was performed using t-test. Error bars represent the standard error. **p < 0.01; ***p < 0.001. e Dysregulated GO biological process revealed by functional enrichment analysis of the differentially expressed genes resulting from G870S mutation. f Gene set enrichment analysis displaying three of the most enriched categories. Genes are shown as a function of the enrichment score (y axis in the upper part) and relative gene expression (x axis)
Fig. 3
Fig. 3
SETBP1-mediated epigenetic modulation. a Histone modification ChIP-Seq peak distribution densities plotted according to their distance from gene transcription start sites. b Epigenetic changes resulting from the presence of SETBP1-G870S expressed as function of SETBP1 differential DNA binding (ChIP-Seq G870S/Empty fold change in x axis) vs. histone modification differential enrichment (G870S/Empty fold change in y axis). ***p < 0.001 c SETBP1 ChIP-Seq coverage track and peak alignment to the hg19 reference genome are superimposed to the different histone methylation ChIP-Seq coverage tracks within the BMP5 locus. d Gene expression heatmap of the subset of SETBP1 targets harboring increased H3K4me2 and H3K9ac activation marks generated on three Empty and three SETBP1-G870S clones
Fig. 4
Fig. 4
SETBP1 interacts with the SET1/KMT2A COMPASS-like complex. a Co-immunoprecipitation was performed against the HCF1 protein (left) or the V5 flag (right) and blotted with an anti-V5 or HCF1 antibody. b, c FRET analysis showing physical interaction between SETBP1 and HCF1. Positive FRET signal was recorded in both couples of HCF1 and SETBP1 WT or G870S (b, green and blue lines), conversely no FRET signal was recorded for HCF1 and SETBP1ΔHBM or G870SΔHBM (b, red and orange lines). FRET between β-TrCP and SETBP1 variants was assayed to demonstrate that ΔHBM did not modify the known SETBP1–β-TrCP interaction (c). Acceptor photobleaching was performed after the third acquired frame and indicated with gray bars in both the graphs. Bars represent the standard error of three experiments. d Relative expression of SETBP1 target genes as assessed by Q-PCR in empty (black), SETBP1-G870S (orange), and SETBP1-G870S-ΔHBM (light orange) lines. e Co-immunoprecipitation was performed against the V5 flag and blotted with an anti-KMT2A antibody. f ChIP against H4K20me1 followed by Q-PCR on a set of SETBP1 target genes performed on Empty (black bars) and SETBP1-G870S cells (orange bars). g Co-immunoprecipitation was performed against the V5 flag and blotted with anti-PHF8 and anti-PHF6 antibodies. h Proposed model for SETBP1 epigenetic network. i Relative expression of SETBP1 target genes in cells transduced with empty vector, SETBP1-G870S, or SETBP1-G870S carrying deletion of the first (ΔATH1), second (ΔATH2), and both (ΔATH1,2) AT-hooks. j ChIP against SETBP1-G870S in cells transduced with empty vector, SETBP1-G870S, or SETBP1-G870S carrying deletion of the first (ΔATH1), second (ΔATH2), or both (ΔATH1,2) AT-hooks, followed by Q-PCR on a set of SETBP1 target genes. In panels d, f, i and j, statistical analysis was performed using t-test. Bars represent the standard error of three experiments. *p < 0.05; **p < 0.01; ***p < 0.001
Fig. 5
Fig. 5
Analysis of MECOM expression and downstream targets. a Box plot showing the RNA-Seq differential expression analysis of MECOM in the 293 FLP-In Empty, SETBP1-WT, and SETBP1-G870S cell models. The top and bottom of each box represent the first and third quartile, respectively; the internal line represents the median; the dot represents the mean. Experiments were performed in triplicate. b Q-PCR analysis of MECOM expression in the 293 FLP-In Empty, SETBP1-WT, and SETBP1-G870S cell models. The top and bottom of each box represent the first and third quartile, respectively; the internal line represents the median; the small square represents the mean. Experiments were performed in triplicate; statistical analysis was performed using t-test. c SETBP1 ChIP-Seq coverage track and peak alignment to the hg19 reference genome (blue tracks) are superimposed to the different histone methylation tracks and KMT2A (MLL) ChIP-Seq coverage track within the MECOM locus. The boxed histogram represents an independent ChIP experiment performed against the V5 flag in the FLP-In cells followed by a Q-PCR directed against the predicted SETBP1-G870S-binding locus on the MECOM promoter. ChIP was performed in triplicate; statistical analysis was performed using t-test. d Gene expression heatmap of MECOM target genes in three Empty/SETBP1-G870S FLP-In clones. e Differential MECOM expression as read counts per million of mapped reads (RPM) in 32 aCML patients carrying WT (21) or mutated (11) SETBP1. The top and bottom of the box represent the first and third quartile, respectively; the internal line represents the median. Statistical analysis was performed using t-test. f Linear correlation of MECOM expression as assessed by RNA-Seq (x axis) and Q-PCR (y axis). r represents the Pearson linear correlation coefficient. g Gene expression heatmap of MECOM target genes in 32 aCML patients carrying WT (21) or mutated SETBP1 (11). Error bars represent the standard error. *p < 0.05; **p < 0.01; ***p < 0.001
Fig. 6
Fig. 6
In utero electroporation of GFP and SETBP1-G870S. a Schematic representation of the electroporation procedure. b Snapshots from 3D reconstruction resulting from 2-photon microscopy on either GFP- or SETBP1-electroporated cortices (2 days) after tissue clarification (X-Clarity system) showed defects in radial migration of the SETBP1-G870S misexpressing cells. p pial side, v ventricular side. The GFP signal in the pial membrane (white arrows) and along the thickness of the SETBP1-G870S tissue (red arrow) is due to the basal processes of the GFP+ radial glia cells located in the deepest part of the organ. c Immunohistochemistry for GFP and TBR2 on coronal section of 2 days electroporated tissues. d Five-day electroporated cortices and quantification of the migration of the GFP+ cells from apical (bin #1) to pial part of the organ (bin #5); arrow indicates GFP+ corpus callosum. Statistical analysis was performed using two-way ANOVA; error bars represent standard error. *p < 0.05; **p < 0.01; ***p < 0.001; ***p<0.0001.  e Immunohistochemistry for GFP and SATB2 marker on coronal section of 5 days electroporated tissues. In the insets on the right, the images of SETBP1-G870S DAPI (up), GFP, SATB2, and merge of GFP/SATB2 (bottom) are shown. cp cortical plate, iz intermediate zone, svz subventricular zone, vz ventricular zone. Bars: c, e: 100 μm, d: 250 μm

References

    1. Piazza R, et al. Recurrent SETBP1 mutations in atypical chronic myeloid leukemia. Nat. Genet. 2013;45:18–24. - PMC - PubMed
    1. Sakaguchi H, et al. Exome sequencing identifies secondary mutations of SETBP1 and JAK3 in juvenile myelomonocytic leukemia. Nat. Genet. 2013;45:937–941. - PubMed
    1. Makishima H, et al. Somatic SETBP1 mutations in myeloid malignancies. Nat. Genet. 2013;45:942–946. - PMC - PubMed
    1. Meggendorfer M, et al. SETBP1 mutations occur in 9% of MDS/MPN and in 4% of MPN cases and are strongly associated with atypical CML, monosomy 7, isochromosome i(17)(q10), ASXL1 and CBL mutations. Leukemia. 2013;27:1852–1860. - PubMed
    1. Inoue D, et al. SETBP1 mutations drive leukemic transformation in ASXL1-mutated MDS. Leukemia. 2015;29:847–857. - PMC - PubMed

Publication types

MeSH terms

Supplementary concepts