

Large-scale genetic panmixia in the blue shark (Prionace glauca): A single worldwide population, or a genetic lag-time effect of the "grey zone" of differentiation?
- PMID: 29875806
- PMCID: PMC5978958
- DOI: 10.1111/eva.12591
Large-scale genetic panmixia in the blue shark (Prionace glauca): A single worldwide population, or a genetic lag-time effect of the "grey zone" of differentiation?
Abstract
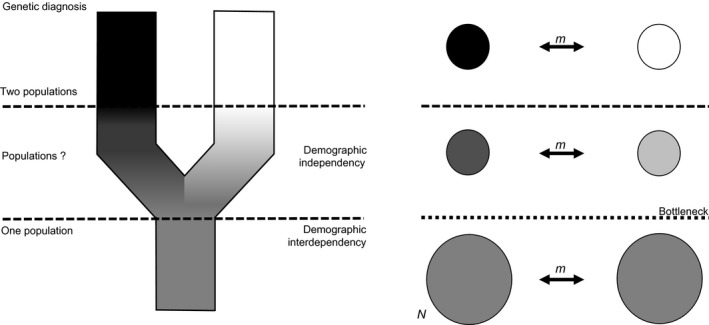
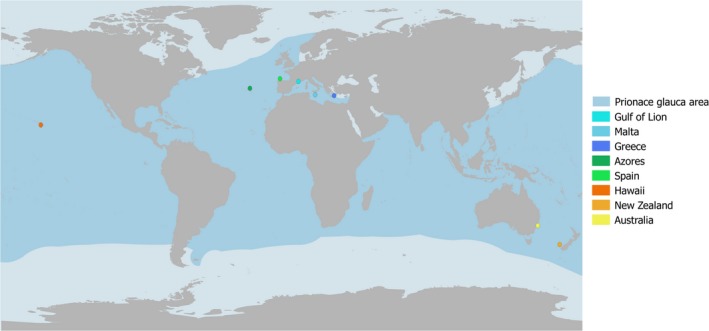
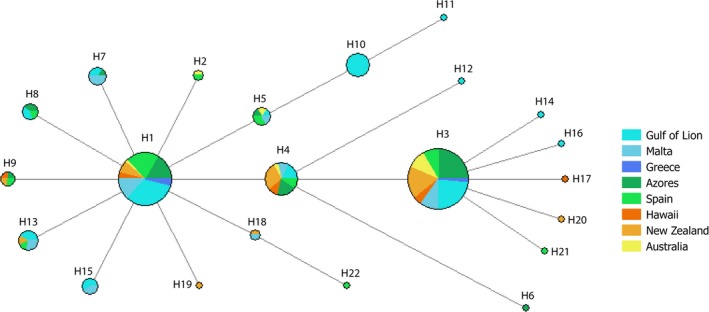
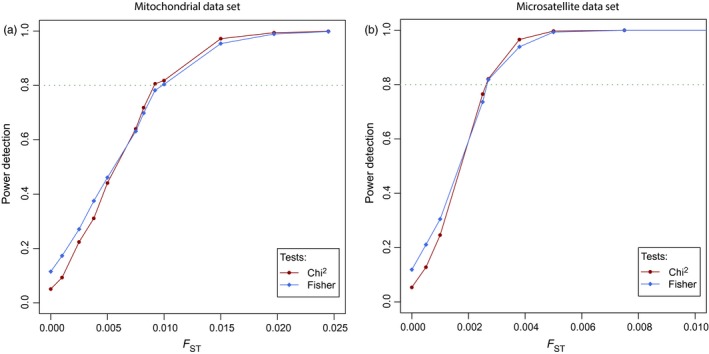
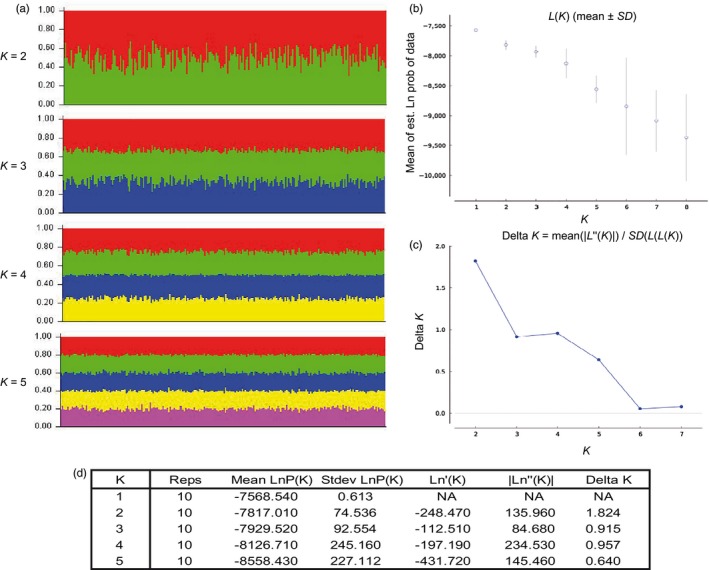
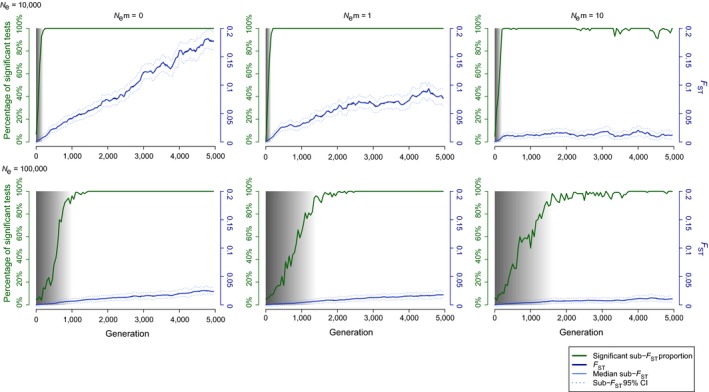
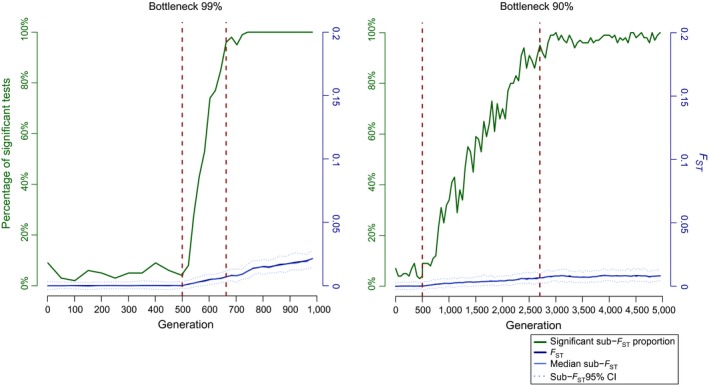
The blue shark Prionace glauca, among the most common and widely studied pelagic sharks, is a top predator, exhibiting the widest distribution range. However, little is known about its population structure and spatial dynamics. With an estimated removal of 10-20 million individuals per year by fisheries, the species is classified as "Near Threatened" by International Union for Conservation of Nature. We lack the knowledge to forecast the long-term consequences of such a huge removal on this top predator itself and on its trophic network. The genetic analysis of more than 200 samples collected at broad scale (from Mediterranean Sea, North Atlantic and Pacific Oceans) using mtDNA and nine microsatellite markers allowed to detect signatures of genetic bottlenecks but a nearly complete genetic homogeneity across the entire studied range. This apparent panmixia could be explained by a genetic lag-time effect illustrated by simulations of demographic changes that were not detectable through standard genetic analysis before a long transitional phase here introduced as the "population grey zone." The results presented here can thus encompass distinct explanatory scenarios spanning from a single demographic population to several independent populations. This limitation prevents the genetic-based delineation of stocks and thus the ability to anticipate the consequences of severe depletions at all scales. More information is required for the conservation of population(s) and management of stocks, which may be provided by large-scale sampling not only of individuals worldwide, but also of loci genomewide.
Keywords: Prionace glauca; blue shark; conservation; fisheries; genetic panmixia; stock.
Figures
References
-
- Aires‐da‐Silva, A. , Ferreira, R. L. , & Pereira, J. G. (2008). Case study: Blue shark catch‐rate patterns from the Portuguese swordfish longline fishery in the Azores In Camhi M. D., Pikitch E. K., & Babcock E. A. (Eds.), Sharks of the open ocean: Biology, fisheries and conservation (pp. 230–235). Oxford, UK: Blackwell Publishing; https://doi.org/10.1002/9781444302516 - DOI
-
- Altukhov, Y. P. (1981). The stock concept from the viewpoint of population genetics. Canadian Journal of Fisheries and Aquatic Sciences, 38, 1523–1538. https://doi.org/10.1139/f81-205 - DOI
-
- Bandelt, H. J. , Forster, P. , & Röhl, A. (1999). Median‐joining networks for inferring intraspecific phylogenies. Molecular Biology and Evolution, 16, 37–48. https://doi.org/10.1093/oxfordjournals.molbev.a026036 - DOI - PubMed
-
- Barnett, A. , Abrantes, K. G. , Stevens, J. D. , & Semmens, J. M. (2011). Site fidelity and sex‐specific migration in a mobile apex predator: Implications for conservation and ecosystem dynamics. Animal Behaviour, 81, 1039–1048. https://doi.org/10.1016/j.anbehav.2011.02.011 - DOI
-
- Baum, J. K. , Myers, R. A. , Kehler, D. G. , Worm, B. , Harley, S. J. , & Doherty, P. A. (2003). Collapse and conservation of shark populations in the Northwest Atlantic. Science, 299, 389–392. https://doi.org/10.1126/science.1079777 - DOI - PubMed
Associated data
LinkOut - more resources
Full Text Sources
Other Literature Sources
