. 2017 May;2(5):17014.
doi: 10.1038/natrevmats.2017.14. Epub 2017 May 3.

Towards clinically translatable in vivo nanodiagnostics

Affiliations

Towards clinically translatable in vivo nanodiagnostics

Seung-Min Park et al. Nat Rev Mater. 2017 May.

Abstract

Nanodiagnostics as a field makes use of fundamental advances in nanobiotechnology to diagnose, characterize and manage disease at the molecular scale. As these strategies move closer to routine clinical use, a proper understanding of different imaging modalities, relevant biological systems and physical properties governing nanoscale interactions is necessary to rationally engineer next-generation bionanomaterials. In this Review, we analyse the background physics of several clinically relevant imaging modalities and their associated sensitivity and specificity, provide an overview of the materials currently used for in vivo nanodiagnostics, and assess the progress made towards clinical translation. This work provides a framework for understanding both the impressive progress made thus far in the nanodiagnostics field as well as presenting challenges that must be overcome to obtain widespread clinical adoption.

Keywords: Physical sciences / Engineering / Biomedical engineering [URI /639/166/985]; Physical sciences / Materials science / Nanoscale materials [URI /639/301/357]; Physical sciences / Nanoscience and technology / Nanomedicine [URI /639/925/352]; Physical sciences / Nanoscience and technology / Nanoscale materials [URI /639/925/357].


Conflict of interest statement

Competing interests statement The authors declare no competing interests.

Figures

Figure 1
Figure 1. Timeline of the development of bioimaging modalities and imaging agents towards nanodiagnostics
The development of imaging instrumentation was mainly accomplished by the middle of the 1980s, and nanoagents have been continuously developed since then. C dots, Cornell dots; CT, computed tomography; FDG, fluorodeoxyglucose; Gd-DTPA, gadopentetic acid; MRI, magnetic resonance imaging; PET, positron emission tomography; 99mTc, metastable technetium.
Figure 2
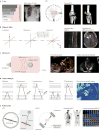
Figure 2. Clinically used primary imaging modalities and their corresponding basic physical principles
a | Clinical X-ray imaging with computed tomography (CT) primarily relies on tissue-specific attenuation of photons. Tuberculosis can be typically determined by posterior–anterior chest X-ray to investigate the existence of consolidations and/or cavities in the lung. Tibial plateau fractures can be visually represented in 3D by CT. CT scans are occasionally critical for assessing degree of fractures and guiding treatment. b | MRI uses magnetization of protons in tissues, such that the density of protons determines the contrast of tissues. Therefore, MRI is commonly used to diagnose anatomical anomalies, such as torn or damaged ligaments or herniated lumbar discs, as well as head- and neck-related diseases, such as brain tumours. c | Ultrasound uses a mechanical sound wave to characterize tissue-specific echoing properties, and is commonly used in obstetrics and gynaecology owing to its non-invasiveness. In addition, the Doppler effect can be used alongside ultrasound imaging to interrogate moving objects in the human body. d | Various optical imaging modalities are heavily dependent on photon–electron interactions, as shown in the Jablonski diagrams. Colonoscopy and fluorescence-guided surgery are examples of clinically used optical modalities using photon–electron interactions. e | PET and SPECT use injected radionuclides to generate signals from inside the body. Applications of these radio-modalities include the assessment of oncological activities or cardiac ischaemia. MRI, magnetic resonance imaging; NIR, near-infrared; PET, positron emission tomography; RF, radiofrequency; SPECT, single-photon emission computed tomography. Panel a courtesy of H. Guo and G. Gold, Stanford University. Panel b courtesy of D.-h. Ha, Stanford University. Panel c courtesy of R. Barth and J. Wu, Stanford University. Panel d courtesy of E. Rosenthal, Stanford University. Panel e courtesy of A. Iagaru, Stanford University, USA.
Figure 3
Figure 3. Examples of nanoparticles used in preclinical imaging
a | Extremely small-sized iron oxide nanoparticles (ESIONs) only a few nanometres in diameter exhibit relatively weak magnetic moments, suitable for T1 MRI contrast enhancement. A TEM image of iron oxide nanoparticles and an ESION-enhanced blood pool MRI of a rat obtained by 3D-FLASH sequence are displayed. b | A TEM image of Resovist, with magnetic resonance images of Huh7 orthotropic liver cancer model, are shown. Arrows indicate the location of tumours. c | In contrast to smaller iron oxide nanoparticles, larger iron oxide nanoparticles are suitable for the contrast enhancement in T2* MR images. Ferrimagnetic iron oxide nanoparticles are known to have the highest relaxivity among single iron oxide nanoparticles. d | Gold nanoparticles with various shapes for various purposes are displayed in SEM and TEM images. Owing to the high atomic number and free electrons of gold, GNPs have been widely used in the fields of plasmonics, X-ray, X-ray fluorescence computed tomography (XFCT), and so on. As an example, a tumour-bearing mouse injected with GNPs is accurately imaged with a benchtop XFCT. e | Biocompatible inorganic luminophores (Si or ZnS) that overcome the conventional limitations of quantum dots are shown. However, limitations exist, including excitation wavelengths. They have great applicability in multiphoton intravital imaging. f | Carbon nanotubes have unique optical and electrical properties that are widely used in NIR imaging. GNP, graphene nanoparticle; MRI, magnetic resonance imaging; NIR, near-infrared; SEM, scanning electron microscopy; TEM, transmission electron microscopy. Panel a is reproduced with permission from REF. , American Chemical Society. Panel b (left image) is reproduced with permission from REF. , American Institute of Physics. Panel b (right image) is reproduced with permission from REF. , American Chemical Society. Panel c is reproduced with permission from REF. , National Academy of Sciences. Panel d (left image, top left) is reproduced with permission from REF. , Wiley-VCH. Panel d (left image, top right) is reproduced with permission from REF. , American Chemical Society. Panel d (left image, bottom right) is reproduced with permission from REF. , Wiley-VCH. Panel d (left image, bottom left) is reproduced with permission from REF. , American Chemical Society. Panel d (right image) is reproduced with permission from REF. , Macmillan Publishers Limited. Panel e is reproduced with permission from REF. , Macmillan Publishers Limited. Panel f (left image) is reproduced with permission from REF. , Macmillan Publishers Limited. Panel f (right image) is reproduced with permission from REF. , Macmillan Publishers Limited.
Figure 4
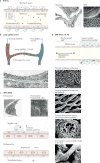
Figure 4. In vivo nanoparticle accumulation, clearance and filtration
The figure shows the fate of nanoparticles and describes their accumulation and clearance sites. After injection, 99% of injected nanoparticles will face sequestration or clearance either by the reticuloendothelial system, including the liver and spleen, or by filtration of the kidney. a | Kidney filtration or renal clearance is responsible for the filtration of nanoparticles, typically smaller than 6 nm in their hydrodynamic diameter. As shown in the scanning electron microscopy (SEM) images and histology, the numerous, round fenestrations over the entire glomerular cell surface (endothelial lining) serve as a filter for nanoparticle clearance. Filtered nanoparticles are then drained to the bladder and finally cleared through urination. b | Micrometre-sized particles are physically filtered by capillary beds in the lungs, which are known to be the smallest capillaries. c | The liver is a representative reticuloendothelial system and a major entrapment site for injected nanoparticles. Phagocytic cells, including Kupffer cells in the liver, preferentially entrap negatively charged nanoparticles smaller than 150 nm. Entrapped nanoparticles will eventually be cleared from the body via the bile duct. In addition, fenestration of endothelial cells (SEM inset) and intracellular gaps allow nanoparticles to extravasate as a part of clearance. d | The enhanced permeation and retention (EPR) effect enables nanoparticles with sizes of 100–200 nm to accumulate and retain in the tumour interstitium owing to its leaky vasculature structures. This mechanism is further enhanced in tumours because of the lack of a draining lymphatic system. Electron micrographs show the contrast between normal and cancerous tissues. On average, 0.7% of intravenously injected nanoparticles arrive at tumour sites. MPS, mononuclear phagocytic system; RES, reticuloendothelial system. Histological image in panel a is reproduced with permission from REF. , Elsevier. Scanning electron microscopy image in panel a is reproduced with permission from REF. , Public Library of Science. The micrograph of a phagocytic Kupffer cell in panel c is reproduced with permission from REF. , BioMed Central. The micrograph of the hepatic endothelial fenestrae in panel c is reproduced with permission from REF. , Wiley-VCH. Electron micrographs in panel d are reproduced with permission from REF. , Springer.
Figure 5
Figure 5. Clinical translation of nanomaterial imaging agents
a | A 7 mm hepatocellular carcinoma nodule in a 61-year-old man shows low attenuation in the CT scan (arrow, left) and nodular hyperintensity on an SPIO-enhanced T2-weighted magnetic resonance image (arrow, right). b | Whole-body PET-CT imaging of particle biodistribution of Cornell dots (C dots) in a single patient showing a hypodense left hepatic lobe metastasis on a reformatted coronal CT scan (first image). Particle uptake is shown in the peripheral tumour area 4 hours after injection through coronal PET (second image), and in the bladder, stomach, intestines, gallbladder and heart (third and fourth images), and the hepatic metastasis with standard [18F]FDG PET–CT (fifth image). c | Long-axis view of a patient undergoing cardiovascular magnetic resonance imaging (MRI). Comparison of pre- and post-Feraheme scans in the setting of septal myocardial infarction shows hyperenhancement in the septal wall after 0 and 24 hours post-Feraheme injection (left and right images, respectively). d | Increased pancreatic ferumoxytol uptake in a patient with recently diagnosed type I diabetes (left) compared with a healthy control subject (right) seen with MRI. e | In vivo MRI of AβO-targeted probe mice showing hippocampal localization in an Alzheimer disease model (left) compared with a wild-type control brain (right). FDG, fluorodeoxyglucose; PET–CT, positron emission tomography–computed tomography; SPIO, superparamagnetic iron oxide. Panel a is reproduced with permission from REF. , Radiological Society of North America. Panel b is reproduced with permission from REF. , AAAS. Panel c is reproduced with permission from REF. , American Heart Association. Panel d is reproduced with permission from REF. , National Academy of Sciences. Panel e is reproduced from REF. , Macmillan Publishers Limited.

References

    1. Cairns J. The treatment of diseases and the war against cancer. Sci Am. 1985;253:51–59. - PubMed
    1. Nestor PJ, Scheltens P, Hodges JR. Advances in the early detection of Alzheimer’s disease. Nat Med. 2004;10(Suppl):S34–S41. - PubMed
    1. Greish K. Enhanced permeability and retention (EPR) effect for anticancer nanomedicine drug targeting. Methods Mol Biol. 2010;624:25–37. - PubMed
    1. Lee DE, et al. Multifunctional nanoparticles for multimodal imaging and theragnosis. Chem Soc Rev. 2012;41:2656–2672. - PubMed
    1. Anker JN, et al. Biosensing with plasmonic nanosensors. Nat Mater. 2008;7:442–453. - PubMed