. 2018 May 23:8:172.
doi: 10.3389/fcimb.2018.00172. eCollection 2018.

Rational Design and Evaluation of an Artificial Escherichia coli K1 Protein Vaccine Candidate Based on the Structure of OmpA

Affiliations

Rational Design and Evaluation of an Artificial Escherichia coli K1 Protein Vaccine Candidate Based on the Structure of OmpA

Hao Gu et al. Front Cell Infect Microbiol. .

Abstract

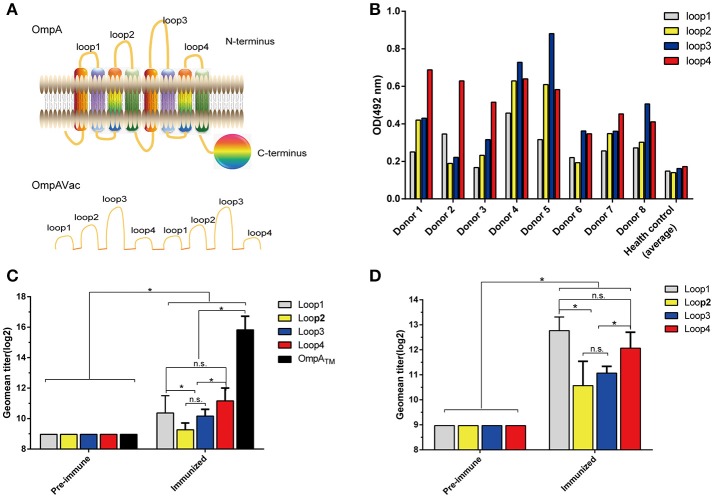
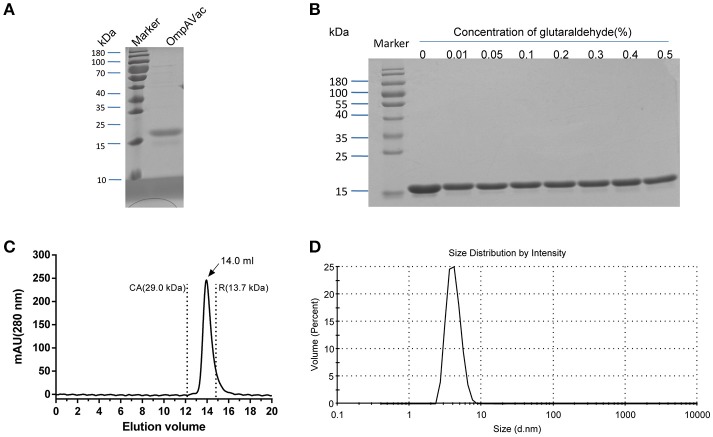
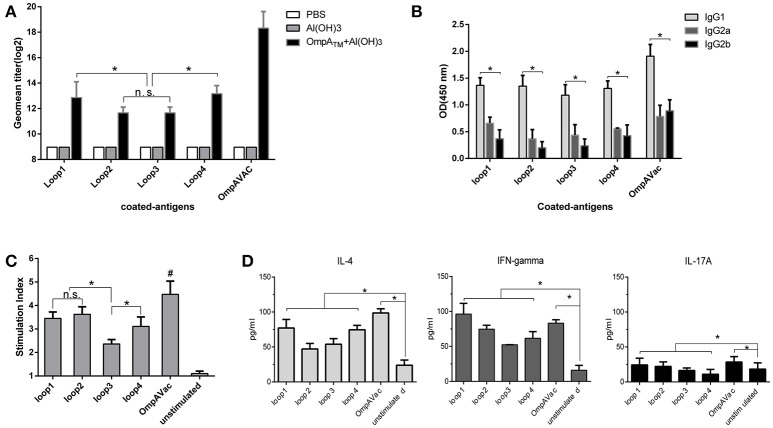
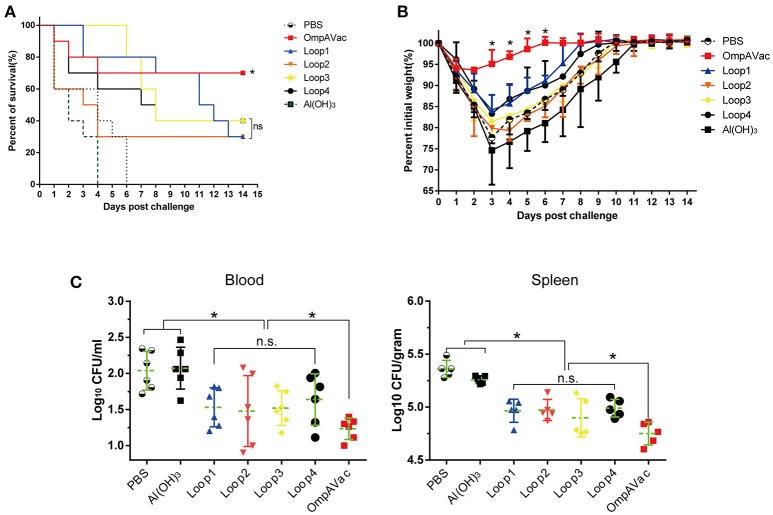
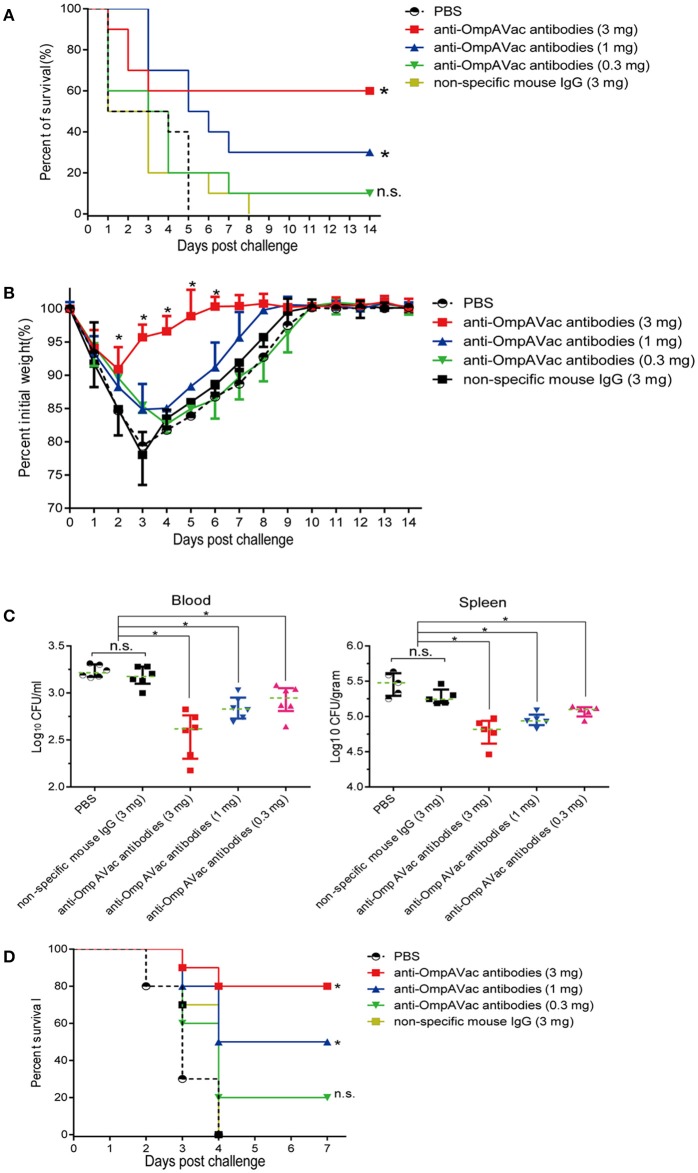
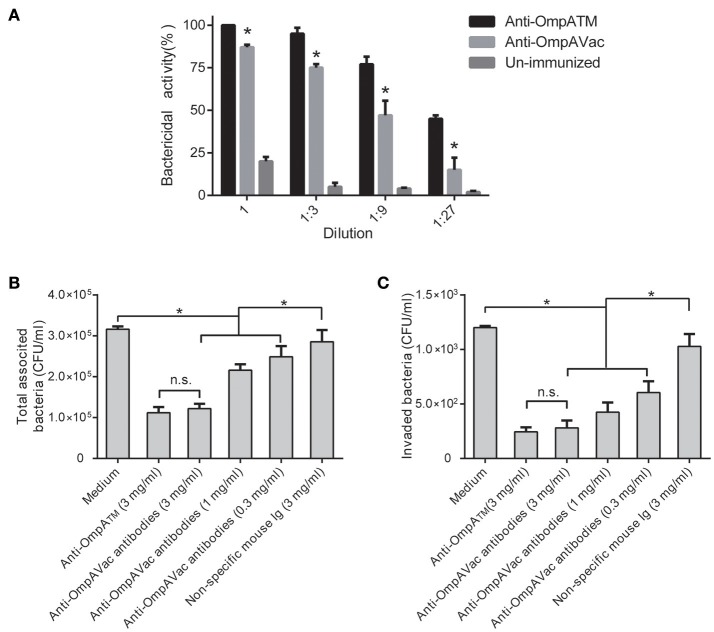
Escherichia coli (E. coli) K1 causes meningitis and remains an unsolved problem in neonates, despite the application of antibiotics and supportive care. The cross-reactivity of bacterial capsular polysaccharides with human antigens hinders their application as vaccine candidates. Thus, protein antigens could be an alternative strategy for the development of an E. coli K1 vaccine. Outer membrane protein A (OmpA) of E. coli K1 is a potential vaccine candidate because of its predominant contribution to bacterial pathogenesis and sub-cellular localization. However, little progress has been made regarding the use of OmpA for this purpose due to difficulties in OmpA production. In the present study, we first investigated the immunogenicity of the four extracellular loops of OmpA. Using the structure of OmpA, we rationally designed and successfully generated the artificial protein OmpAVac, composed of connected loops from OmpA. Recombinant OmpAVac was successfully produced in E. coli BL21 and behaved as a soluble homogenous monomer in the aqueous phase. Vaccination with OmpAVac induced Th1, Th2, and Th17 immune responses and conferred effective protection in mice. In addition, OmpAVac-specific antibodies were able to mediate opsonophagocytosis and inhibit bacterial invasion, thereby conferring prophylactic protection in E. coli K1-challenged adult mice and neonatal mice. These results suggest that OmpAVac could be a good vaccine candidate for the control of E. coli K1 infection and provide an additional example of structure-based vaccine design.

Keywords: Escherichia coli K1; extracellular loops; meningitis; outer membrane protein A; structure-based vaccine design.


Figures

Figure 1
Figure 1
Rational design of OmpAVac. (A) Schematic representation of OmpA (upper) and OmpAVac (lower). (B) Reactions of loop1, loop2, loop3 and loop4 of OmpA with sera from E. coli K1-infected patients. The optical density (OD) from ELISAs of each patient donor and the average of 10 health donors was shown. (C) Evaluation of the immunogenicity of loop1, loop2, loop3, and loop4 in the form of OmpATM (transmembrane domain of OmpA) fused with MBP (maltose binding protein) tag. The titers of anti-loop1, anti-loop2, anti-loop3, and anti-loop4 antibodies from MBP-OmpATM-immunized mice are shown. (D) Evaluation of the immunogenicity of loop1, loop2, loop3, and loop4 in the form of synthesized peptides. Mice were immunized with synthesized peptides encoding loop1, loop2, loop3, or loop4 of OmpA. The titers of the anti-loop1, anti-loop2, anti-loop3, and anti-loop4 antibodies are shown. The significance of the differences was determined by unpaired parametric tests (Student's t-test for two groups or one-way ANOVA for three or more groups). *indicates a significant difference when P-value is below 0.05, while “n.s.” indicates no significant difference.
Figure 2
Figure 2
Characterization of purified OmpAVac. (A) SDS-PAGE analysis of OmpAVac. The purity of OmpAVac was ~93.2%, as determined based on the density of the corresponding band in an SDS-PAGE gel. (B) Cross-linking assay of OmpAVac. The concentrations of glutaraldehyde in lanes 1–8 were 0, 0.01, 0.05, 0.1, 0.2, 0.3, 0.4, and 0.5%, respectively. No oligomers or aggregates were observed. (C) Chromatography analysis of OmpAVac. OmpAVac produces a symmetrical peak at 14.0 mL, and the elution volumes of the protein standards CA (carbonic anhydrase) and R (ribonuclease A) were 12.2 and 13.7 mL, respectively. (D) Dynamic light-scattering analysis of OmpAVac resulted in a symmetrical peak with a diameter of 3.8 nm.
Figure 3
Figure 3
OmpAVac induces a multifactorial immune response in mice. (A) The bar represents the titer of anti-loop1, anti-loop2, anti-loop3, anti-loop4, and anti-OmpAVac IgGs from OmpAVac-immunized mice. *indicates a significant difference (P < 0.05), while “n.s.” indicates no significant difference. (B) Comparison of the subtypes of anti-loop1, anti-loop2, anti-loop3, anti-loop4, and anti-OmpAVac IgGs from OmpAVac-immunized mice. The OD at 450 nm in each ELISA reaction is shown. *indicates a significant difference in the OD among IgG1, IgG2a, and IgG2b. (C) Proliferative activity of mouse splenocytes after in vitro stimulation with loop1, loop2, loop3, loop4, and OmpAVac for 72 h, respectively. Proliferation was measured using the bromodeoxyuridine (BrdU) labeling method. *indicates a significant difference, while “ns” indicates no significant difference. “#” indicates a significant difference between the OmpVac-stimulated group and the other groups. (D) Cytokine production by antigen-stimulated splenocytes from OmpAVac-immunized mice. Two weeks after the final immunization, the spleens were processed and stimulated with loop1, loop2, loop3, loop4, and OmpAVac for 72 h, and the levels of IL-4, IFN-gamma, and IL-17 in each culture supernatant were measured. The data are shown as the means ± SE and the significance of the differences was determined by unpaired parametric tests (Student's t-test for two groups or one-way ANOVA for three or more groups). *indicates a significant difference (P < 0.05).
Figure 4
Figure 4
OmpAVac vaccination confers protection against E. coli K1 infection. (A) Survival rates of mice challenged with a lethal dose of E. coli K1 RS218. Ten mice in each group were immunized with loop1, loop2, loop3, loop4, and OmpAVac 10 days prior to challenge. The number of survivors was recorded daily for 14 days. The Kaplan-Meier test was employed for analysis of the survival rate. *indicates a significant difference between the OmpVac-immunized group and the other groups. “ns” indicates no difference among loop1-, loop2-, loop3-, and loop4-immunized groups. (B) Change in the weights of immunized mice challenged with a sublethal dose of E. coli K1 RS218. The weight of each mouse was recorded daily for 14 days. The percentage of their initial weight is shown. *indicates a significant difference between the OmpAVac group and the remaining groups. (C) The bacterial load in the blood and spleen of immunized mice at 24 h after challenge with a sublethal dose of E. coli K1 RS218. The log values of the number of bacteria per mL of blood or gram of spleen are shown. The significance of the differences of bacteria load was determined by unpaired nonparametric tests (Mann Whitney test). *indicates a significant difference (P < 0.05), while “n.s.” indicates no significant difference. The data are presented as median and interquartile ranges.
Figure 5
Figure 5
Anti-OmpAVac antibodies contribute to OmpAVac-mediated protection. (A) Survival rates of mice challenged with a lethal dose of E. coli K1 RS218. Ten mice each in each groups were administered 3, 1, and 0.3 mg of anti-OmpAVac antibodies, respectively. Twenty-four hours later, the mice were challenged with a lethal dose of E. coli K1 RS218. The number of survivors was recorded daily for 14 days. Three mg of IgG purified from unimmunized mice was used as a negative control. The Kaplan-Meier test was employed for analysis of the survival rate. *indicates significant difference between vs PBS control group and non-specific mouse Ig group (P < 0.05), while “n.s.” indicates no significant difference (P > 0.05). (B) Weight change in immunized mice challenged with a sublethal dose of E. coli K1 RS218. Mice were administered anti-OmpA IgGs at 24 h prior to challenge. The percentage of their initial weight is shown. The significance of the differences was determined by unpaired parametric tests (one-way ANOVA). *indicates significant difference among the four five groups (P < 0.05). (C) The bacterial load in the blood and spleen of mice challenged with a sublethal dose of E. coli K1 RS218. Mice were administered anti-OmpA IgGs at 24 h prior to challenge. The log values of the number of bacteria per mL of blood or gram of spleen are shown. The significance of the differences of bacteria load was determined by unpaired nonparametric tests (Mann Whitney test). *indicates a significant difference (P < 0.05), while “n.s.” indicates no significant difference (P > 0.05). The data are presented as median and interquartile ranges. (D) Survival rates of newborn mice challenged with a lethal dose of E. coli K1 RS218. Three-days old mice were administrated with three different dose of anti-OmpAVac antibodies 24 h before challenge. PBS and non-specific mouse IgG were used as control. The number of death was recorded daily for 4 days. The Kaplan-Meier test was employed for analysis of the survival rate. *indicates significant difference between vs PBS control group and non-specific mouse Ig group (P < 0.05), while “n.s.” indicates no significant difference (P > 0.05).
Figure 6
Figure 6
Anti-OmpAVac antibodies mediate opsonophagocytosis and inhibit bacterial attachment and invasion. (A) Opsonophagocytic assay of anti-OmpAVac antibodies. Sera from immunized mice were diluted and incubated with E. coli K1. The bar represents the percentage of killed bacteria in a series of dilutions. The data are presented as the means ± SE. Anti-OmpAVac antibodies showed marked bactericidal activity. *indicates a significant difference between anti-OmpAVac group and the unimmunized group (P < 0.05). (B) Total associated bacteria treated with anti-OmpAVac antibodies. The bar represent the mean value plus the standard error of the number of total associated bacteria. (C) Bacterial invasion activity assays for anti-OmpAVac antibodies. The mean value plus the standard error of the number of bacteria invaded into human brain microvascular endothelial cells for each group is shown. Bacteria treated with medium was used as control. The unpaired Student's t-test was used to determine the significance of the differences between two groups. *indicates a significant difference (P < 0.05) while “n.s.” indicates no significant difference.

Similar articles

Cited by

References

    1. Cavallari M., De Libero G. (2017). From immunologically archaic to neoteric glycovaccines. Vaccines 5, 4. 10.3390/vaccines5010004 - DOI - PMC - PubMed
    1. Cierpicki T., Liang B., Tamm L. K., Bushweller J. H. (2006). Increasing the accuracy of solution NMR structures of membrane proteins by application of residual dipolar couplings. High-resolution structure of outer membrane protein A. J. Am. Chem. Soc. 128, 6947–6951. 10.1021/ja0608343 - DOI - PMC - PubMed
    1. Confer A. W., Ayalew S. (2013). The OmpA family of proteins: roles in bacterial pathogenesis and immunity. Vet. Microbiol. 163, 207–222. 10.1016/j.vetmic.2012.08.019 - DOI - PubMed
    1. Croxen M. A., Finlay B. B. (2010). Molecular mechanisms of Escherichia coli pathogenicity. Nat. Rev. Microbiol. 8, 26–38. 10.1038/nrmicro2265 - DOI - PubMed
    1. Dieelberg C., Ribes S., Michel U., Redlich S., Bruck W., Nau R., et al. (2012). Follistatin does not influence the course of Escherichia coli K1 sepsis in a mouse model. Shock 38, 615–619. 10.1097/SHK.0b013e3182748d96 - DOI - PubMed

Publication types

MeSH terms