. 2018 May 23:5:36.
doi: 10.3389/fnut.2018.00036. eCollection 2018.

Metabolomics and Ionomics of Potato Tuber Reveals an Influence of Cultivar and Market Class on Human Nutrients and Bioactive Compounds

Affiliations

Metabolomics and Ionomics of Potato Tuber Reveals an Influence of Cultivar and Market Class on Human Nutrients and Bioactive Compounds

Jacqueline M Chaparro et al. Front Nutr. .

Abstract

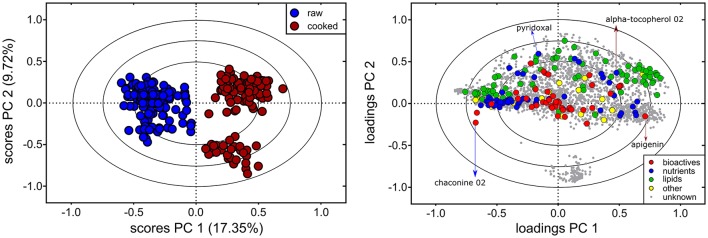
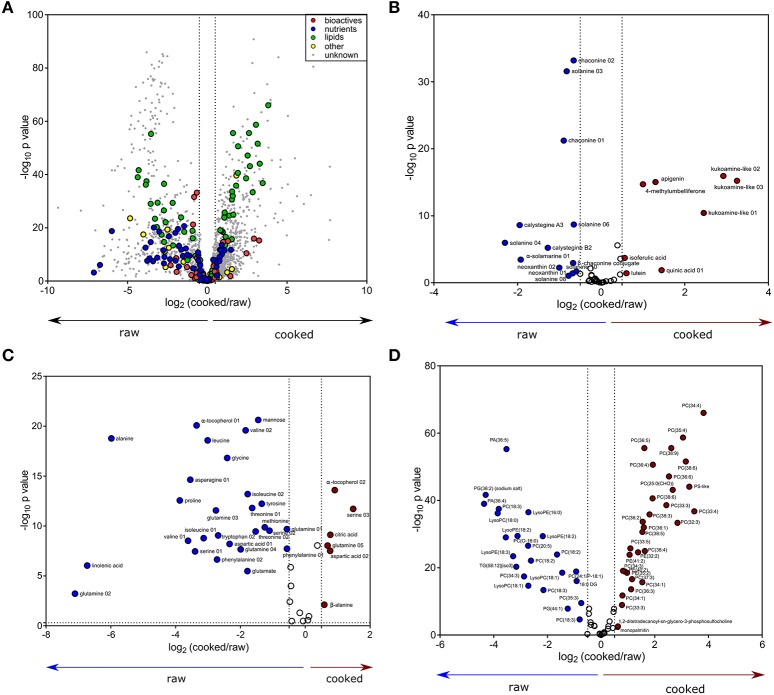
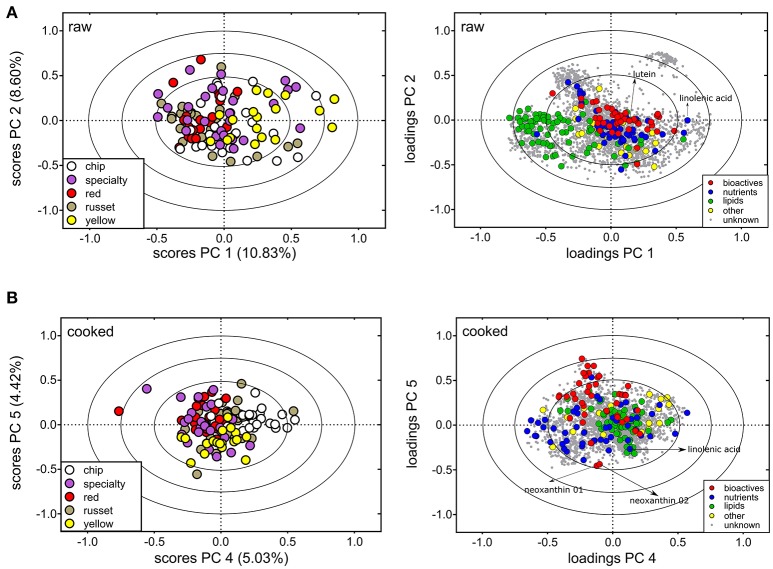
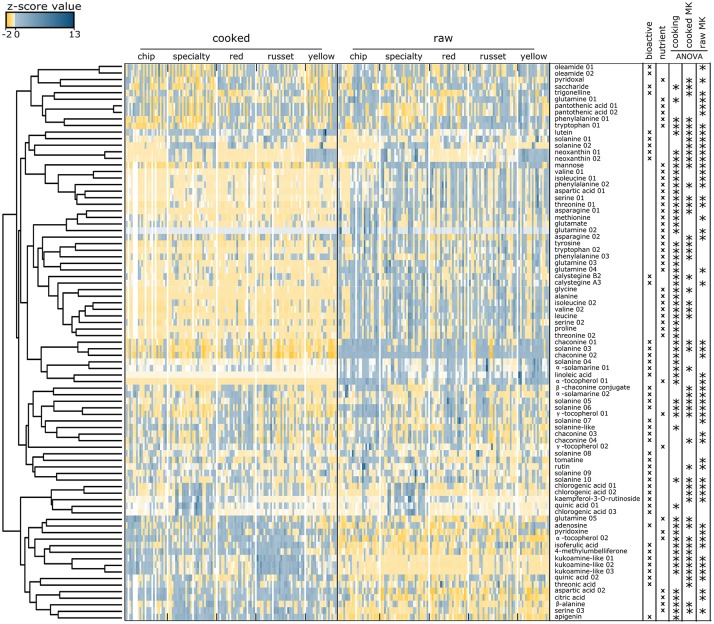
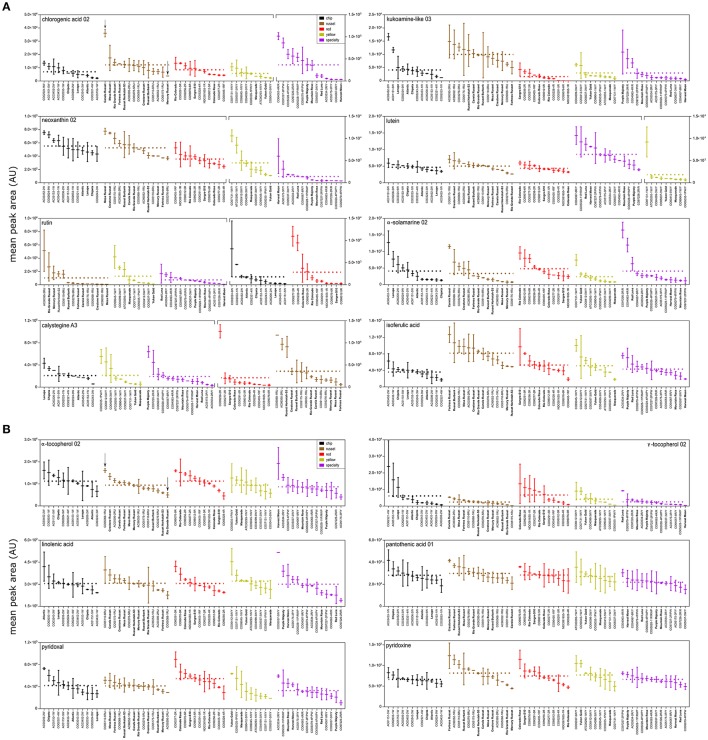
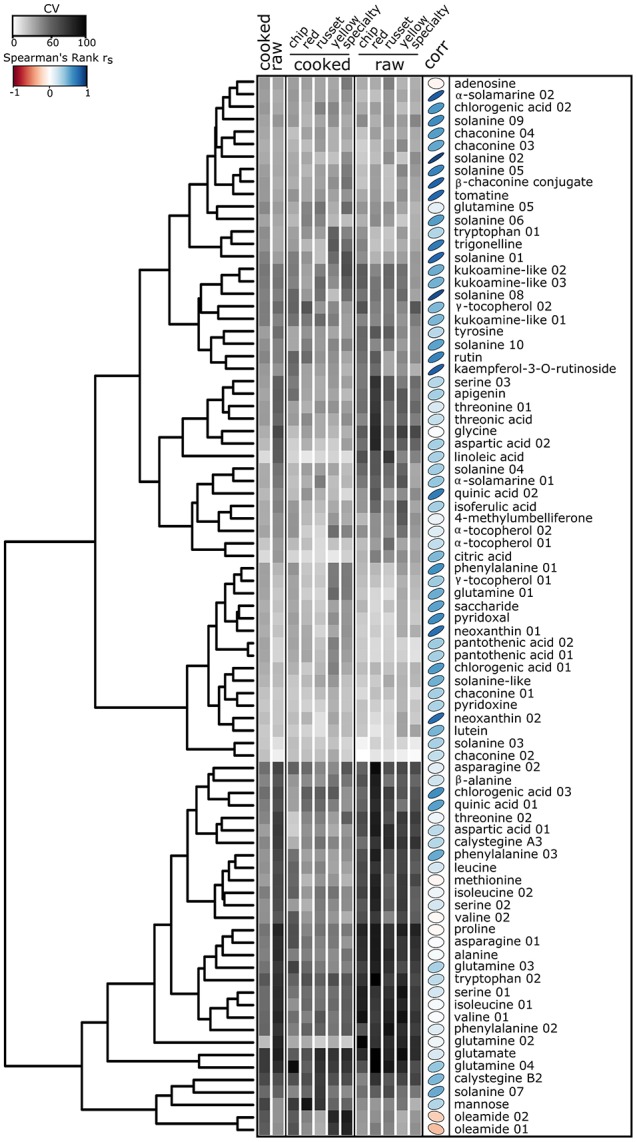
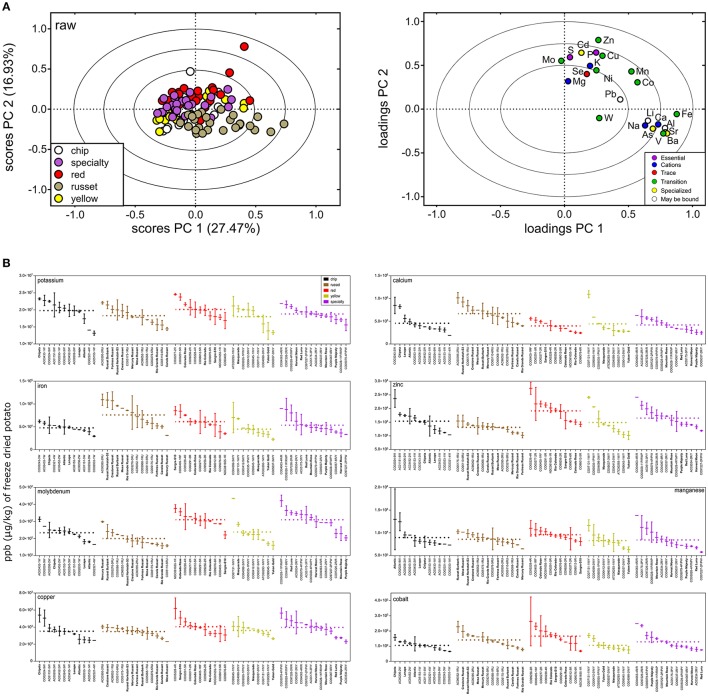
Potato (Solanum tuberosum L.) is an important global food crop that contains phytochemicals with demonstrated effects on human health. Understanding sources of chemical variation of potato tuber can inform breeding for improved health attributes of the cooked food. Here, a comprehensive metabolomics (UPLC- and GC-MS) and ionomics (ICP-MS) analysis of raw and cooked potato tuber was performed on 60 unique potato genotypes that span 5 market classes including russet, red, yellow, chip, and specialty potatoes. The analyses detected 2,656 compounds that included known bioactives (43 compounds), nutrients (42), lipids (76), and 23 metals. Most nutrients and bioactives were partially degraded during cooking (44 out of 85; 52%), however genotypes with high quantities of bioactives remained highest in the cooked tuber. Chemical variation was influenced by genotype and market class. Specifically, ~53% of all detected compounds from cooked potato varied among market class and 40% varied by genotype. The most notable metabolite profiles were observed in yellow-flesh potato which had higher levels of carotenoids and specialty potatoes which had the higher levels of chlorogenic acid as compared to the other market classes. Variation in several molecules with known association to health was observed among market classes and included vitamins (e.g., pyridoxal, ~2-fold variation), bioactives (e.g., chlorogenic acid, ~40-fold variation), medicinals (e.g., kukoamines, ~6-fold variation), and minerals (e.g., calcium, iron, molybdenum, ~2-fold variation). Furthermore, more metabolite variation was observed within market class than among market class (e.g., α-tocopherol, ~1-fold variation among market class vs. ~3-fold variation within market class). Taken together, the analysis characterized significant metabolite and mineral variation in raw and cooked potato tuber, and support the potential to breed new cultivars for improved health traits.

Keywords: Solanum tuberosum L.; bioactive compounds; human health; ionomics; non-targeted metabolomics; nutrients; potato.


Figures

Figure 1
Figure 1
Influence of cooking on the potato tuber metabolome. Principal Component Analysis (PCA) of the 60 cooked (red) and raw (blue) potato tuber metabolomes show that cooking was a major facet of metabolite variation, indicated by separation along PC 1 in the scores plot (left). Metabolite variation attributed to other factors was also observed (i.e., PC 2). The 2,656 metabolites detected are shown on the PC loadings plot (right), and colors represents metabolite class (bioactives, nutrients, lipids, others, and unknowns). Example nutrients and bioactives are indicated by arrows. Red arrows indicate nutrients or bioactives more abundant in cooked potato tubers and blue arrows indicate nutrients or bioactives more abundant in raw potato tubers. The PCA loadings and scores plot are correlation scaled and ellipses denote 0.5, 0.75, and 1.0 correlation values.
Figure 2
Figure 2
Variation in cooked and raw potato tuber metabolites. (A) Volcano plot for the differential abundance (log2 cooked/raw, x-axis) and significance (–log10 FDR adjusted p-value, y-axis) of 2,656 metabolites (colored circles) detected by UPLC- and GC-MS across 60 cultivars of raw and cooked potato tubers. Color represents metabolite class, and vertical dashed lines are a threshold of cooked/raw [log2(cooked/raw) < -0.5 or >0.5]. Subsets of the volanco plot in (A) were recreated for (B) bioactives, (C) nutrients, and (D) lipids. The subset volcano plots are colored to indicate metabolites reduced during cooking (blue), increased during cooking (red), or metabolites that did not vary due to cooking (white).
Figure 3
Figure 3
Metabolite variation among potato market classes. PCA analysis for (A) raw tuber and (B) cooked tuber colored according to potato market class. For raw potato, PC 1 and PC 2 explained variation among market class for 124 metabolites (colored circles). For cooked potato, PC 4 and PC 5 separated market class explained by 100 metabolites. Metabolites denoted on the PCA loadings plot exhibit increased abundance in yellow potato. PCA loadings and scores plot are correlation scaled and ellipses denote 0.5, 0.75, and 1.0 correlation values.
Figure 4
Figure 4
Heat map of nutrients and bioactive compounds identified in cooked and raw potato tubers. Z-score values of the 85 metabolites annotated as nutrients or bioactives evaluated by hierarchical clustering. Two main clusters were formed: metabolites in high abundance in raw tubers and low abundance in cooked tubers (top), and metabolites in low abundance in raw and high abundance in cooked (bottom). Each colored square represents the centered and scaled relative abundance of a metabolite (z-score). Z-scores were calculated as follows: z = (X – μ)/σ, where X is the relative abundance of a metabolite, μ is the mean abundance for the metabolite among all samples, σ is the standard deviation among all samples. Hierarchical clustering was performed using Euclidian distances. Metabolite names with a number indicate isomers of the same compound. Statistical significance was calculated using a one-way ANOVA and adjusted for false discovery.
Figure 5
Figure 5
Metabolite variation among and within potato market class. Box and whisker plots of (A) bioactive and (B) nutrient compounds in cooked potato demonstrate greater variation within potato market class than among potato market class. Potato genotypes within each market class (colored) are arranged from highest mean peak area (normalized abundance) to lowest mean peak area. Fold variation within a market class is calculated as mean normalized abundance of the highest potato cultivar within a potato market class divided by the mean normalized abundance a of the lowest potato variety within a potato market class. Dashed line represents mean normalized abundance for a market class. Fold variation among potato market classes is calculated as mean normalized abundance of the highest potato market class over average mean peak area of lowest potato market class. Potato genotypes in bold denote potato cultivars (released commercial varieties). Plot breaks are used to account for plotting large differences in metabolite abundances.
Figure 6
Figure 6
Heat map of the relative standard deviation of nutrients and bioactive compounds identified in cooked and raw potato tubers. Gray squares represent the mean coefficient of variation (CV) for each of the 85 nutrients and bioactives within raw or cooked samples (n = 120), and among market class within raw or cooked tubers. CV was calculated as: CV = σ/μ *100, where σ is the standard deviation or the metabolite for each individual cultivar within a treatment and μ is the mean abundance for the metabolite for each individual cultivar within a treatment. The CV is calculated for each individual cultivar, averaged across treatments, and represented as a heat map. Hierarchical clustering was performed using Euclidian distances. Spearman's rank correlation rs (corr) between cooked and raw metabolites color and ellipse eccentricity denote rs.
Figure 7
Figure 7
Mineral variation in raw potato tuber. (A) PCA was performed on the potato ionome and colored according to potato market class (scores plot, left). PC 1 and PC 2 explained variation among market class for 23 elements (loadings plot, right). The PCA loadings and scores plot were correlation scaled and ellipses denote 0.5, 0.75, and 1.0 correlation values. (B) Box and whisker plots of micro- and macronutrient distribution highlight greater variation within potato market class than among potato market class. Potato genotypes within each market class (colored) are arranged from highest mean ppb (μg/kg) of freeze-dried potato to lowest. Mean fold variation within a market class is calculated as mean ppb (μg/kg) of freeze-dried potato of highest potato cultivar within a potato market class divided by mean ppb (μg/kg) of freeze-dried potato of lowest potato variety within a potato market class. Dashed line represents mean ppb (μg/kg) of freeze-dried potato for a market class. Mean fold variation between potato market classes is calculated as mean ppb (μg/kg) of freeze-dried potato of highest potato market class divided by mean ppb (μg/kg) of freeze-dried potato of lowest potato market class. Potato genotypes in bold denote potato cultivars (released commercial varieties). Al, aluminum; As, arsenic; Ba, barium; Cd, cadmium; Ca, calcium; Co, cobalt; Cu, copper; Fe, iron; Pb, lead; Li, lithium; Mg, magnesium; Mn, manganese; Mo, molybdenum; Ni, nickel; P, phosphorous; K, potassium; Se, selenium; Na, sodium; Sr, strontium; S, sulfur; W, tungsten; V, vanadium; and Zn, zinc.

References

    1. Daniels ME, Donilon TE, Bollyky TJ. The Emerging Global Health Crisis: Noncommunicable Diseases in Low- and Middle-Income Countries. New York, NY: Council on Foreign Relations Press; (2014).
    1. Roberts CK, Barnard RJ. Effects of exercise and diet on chronic disease. J Appl Physiol. (2005) 98:3–30. 10.1152/japplphysiol.00852.2004 - DOI - PubMed
    1. Story M, Kaphingst KM, Robinson-O'Brien R, Glanz K. Creating healthy food and eating environments: policy and environmental approaches. Annu Rev Public Health (2008) 29:253–72. 10.1146/annurev.publhealth.29.020907.090926 - DOI - PubMed
    1. Nishida C, Uauy R, Kumanyika S, Shetty P. The joint WHO/FAO expert consultation on diet, nutrition and the prevention of chronic diseases: process, product and policy implications. Publ Health Nutr. (2004) 7:245. 10.1079/PHN2003592 - DOI - PubMed
    1. Kris-Etherton PM, Hecker KD, Bonanome A, Coval SM, Binkoski AE, Hilpert KF, et al. . Bioactive compounds in foods: their role in the prevention of cardiovascular disease and cancer. Am J Med. (2002) 113(9 Suppl. 2):71–88. 10.1016/S0002-9343(01)00995-0 - DOI - PubMed

LinkOut - more resources