. 2018 Nov;374(2):389-412.
doi: 10.1007/s00441-018-2861-7. Epub 2018 Jun 6.

The role of G-protein-coupled membrane estrogen receptor in mouse Leydig cell function-in vivo and in vitro evaluation

Affiliations

The role of G-protein-coupled membrane estrogen receptor in mouse Leydig cell function-in vivo and in vitro evaluation

M Kotula-Balak et al. Cell Tissue Res. 2018 Nov.

Abstract

In this study, G-coupled estrogen receptor (GPER) was inactivated, by treatment with antagonist (G-15), in testes of C57BL/6 mice: immature (3 weeks old), mature (3 months old) and aged (1.5 years old) (50 μg/kg bw), as well as MA-10 mouse Leydig cells (10 nM/24 h) alone or in combination with 17β-estradiol or antiestrogen (ICI 182,780). In G-15-treated mice, overgrowth of interstitial tissue was found in both mature and aged testes. Depending on age, differences in structure and distribution of various Leydig cell organelles were observed. Concomitantly, modulation of activity of the mitochondria and tubulin microfibers was revealed. Diverse and complex GPER regulation at the mRNA level and protein of estrogen signaling molecules (estrogen receptor α and β; ERα, ERβ and cytochrome P450 aromatase; P450arom) in G-15 Leydig cells was found in relation to age and the experimental system utilized (in vivo and in vitro). Changes in expression patterns of ERs and P450arom, as well as steroid secretion, reflected Leydig cell heterogeneity to estrogen regulation throughout male life including cell physiological status.We show, for the first time, GPER with ERs and P450arom work in tandem to maintain Leydig cell architecture and supervise its steroidogenic function by estrogen during male life. Full set of estrogen signaling molecules, with involvement of GPER, is crucial for proper Leydig cell function where each molecule acts in a specific and/or complementary manner. Further understanding of the mechanisms by which GPER controls Leydig cells with special regard to male age, cell of origin and experimental system used is critical for predicting and preventing testis steroidogenic disorders based on perturbations in estrogen signaling.

Keywords: Estrogen receptors, estrogens; G-coupled estrogen receptor; Leydig cell; Ultrastructure.


Conflict of interest statement

Conflict of interest

The authors declare that they have no conflict of interest.

Ethical approval

All applicable international, national and/or institutional guidelines for the care and use of animals were followed.

Informed consent

Not applicable.

Figures

Fig. 1
Fig. 1
GPER mRNA level and protein localization in mouse testes and Leydig cells. (af’). a Representative gel electrophoresis of qualitative expression, (line N1-negative control without complementary DNA template, line N2-negative control without nonreverse transcribed RNA), b and relative quantification (RQ) of mRNA for GPER in mouse testes; immature, mature, aged [control and G-15 (50 μg/kg bw)-treated] and mouse MA-10 Leydig cells [control and G-15 (10 nM)-treated]. RQ is expressed as means ± SD. Asterisks show significant differences between control and G-15-treated testes/cells. Values are denoted as *p < 0.05 **p < 0.01. From each animal, three mRNA samples were analyzed. (cf’) Representative microphotographs of cellular localization of GPER in membrane and cytoplasm of Leydig cells of immature (c), mature (d) and aged (e) mouse testes and in membrane of mouse MA-10 Leydig cells (f) (arrows). Immunostaining with DAB and counterstaining with hematoxylin (ce). Scale bars represent 15 μm. Staining was performed on testicular serial sections from at least three animals from each group. Immunofluorescence with DAPI (f, f’). Scale bars represent 20 μm. Immunoreaction was performed on Leydig cell cultures in triplicate. Inserts in (ce) and (f’)—negative controls—no immunostaining is visible when the primary antibody is omitted
Fig. 2
Fig. 2
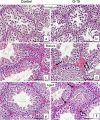
Effect of GPER blockage on mouse testis histology and Leydig cells morphology (a–f). Representative microphotographs of (a, c, e) control and (b, d, f) G-15 (50 μg/kg bw)-treated mouse testes. (a, b) Immature (c, d) mature and (e, f) aged mouse testicular sections. Hematoxylin-eosin staining. Scale bars represent 15 μm. Staining was performed on testicular serial sections from at least three animals of each experimental group. Small clusters of Leydig cells and not active seminiferous tubules but with open lumens in a majority of tubules, in both control and G-15-treated immature males are observed (a, b). Full spermatogenesis in seminiferous tubules of both control and G-15 mature males (c, d). Leydig cells in small groups in control (c) but enlarged interstitial tissue with Leydig cells after exposure to G-15 (d) (arrows) is visible. Full spermatogenesis but not as active as in mature mice is observed in aged control and G-15 males (compare number of elongated spermatids in lumens of tubules c, d and e, f). Leydig cells surrounding seminiferous tubules and located in groups. Subtle differences in abundancy of interstitial tissue are seen between control and G-15 aged males (arrows) (e, f)
Fig. 3
Fig. 3
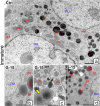
Effect of GPER blockage on Leydig cell ultrastructure. Representative microphotographs of Leydig cells of control and G-15 (50 μg/kg bw)-treated mice. ad Immature Leydig cells ultrathin sections. a Control immature Leydig cells exhibit normal morphology. In control immature Leydig cells, numerous mitochondria (m) and lipid droplets (ld) are seen (a). bd After G-15 treatment in immature Leydig cells, more lipid droplets (ld) are observed; some of them are surrounded with concentrically located rough reticulum endoplasmic (er) cisternae (c; arrow)
Fig. 4
Fig. 4
Effect of GPER blockage on Leydig cell ultrastructure. Representative microphotographs of Leydig cells of control and G-15 (50 μg/kg bw)-treated mice. ad Mature Leydig cells ultrathin sections. In control mature Leydig cells, lipid droplets (ld) are less numerous. a, b Mature Leydig cells exhibit normal morphology. Golgi complexes (Gc) and rough ER (rer) are frequently observed (a, b). c, d In G-15 mature Leydig cells, large mitochondria (m) and numerous lipid droplets (ld) localized in large accumulations are visible
Fig. 5
Fig. 5
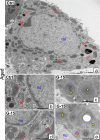
Effect of GPER blockage on Leydig cell ultrastructure. Representative microphotographs of Leydig cells of control and G-15 (50 μg/kg bw)-treated mice. ae Aged mouse Leydig cells ultrathin sections. Each testicular sample in the epoxy resin block was cut for at least three ultrathin sections that were analyzed. Bars represent 1 μm. Analysis was performed on testicular blocks from at least three animals of each experimental group. Aged Leydig cells exhibit normal morphology. In control aged Leydig cells, normal number and localization of endoplasmic reticulum (er), mitochondria (m) and lipid droplets (ld) are seen (a, b). (ce) Note, in G-15 aged Leydig cells, the concentric structure of endoplasmic reticulum (er) cisternae (asterisks; c, e) in between normal-looking and normal-distributed mitochondria (c, d). (nu) nucleus
Fig. 6
Fig. 6
Effect of GPER blockage on Leydig cell mitochondrial activity and cytoskeleton structure. Representative microphotographs and graphs of (aj) mitochondrial activity and (kn) cytoskeleton structure in control, G-15- and E2- treated MA-10 Leydig cells. Representative microphotographs of cellular localization of MitoTracker (ai) in cytoplasm of control (a, g), G-15 (b, h) and G-15 with E2 (17β-estradiol) (c, i)-treated Leydig cells. Immunofluorescence with DAPI (df). Representative microphotographs of cellular localization of TubulinTracker in cytoplasm of control (k), G-15 (l) and G-15 with E2 (m)-treated Leydig cells. Fluorescence without DAPI. Scale bars represent 20 μm. Samples of cultured Leydig cells were measured in triplicate. Quantitative analysis of fluorescence of MitoTracker (j) and TubulinTracker (n). Histograms of fluorescent intensities expressed as relative fluorescence (arbitrary units; a.u.). Data are expressed as means ± SD. Asterisks show significant differences between control and G-15 (50 μg/kg bw) - treated mouse testes and control and G-15 (10 nM), E2 (10 nM) - treated cells for 24 h. Values are denoted as * p < 0.05
Fig. 7
Fig. 7
Effect of GPER blockage on mRNA expression of aromatase and estrogen receptors α and β in mouse testes and Leydig cells in vitro. (a, e) Representative gel electrophoresis of qualitative expression of P450aromatase, ERα, ERβ in mouse testes (immature, mature and aged) (a) and MA-10 Leydig cells (e). (bd, fh) Relative level (relative quantification; RQ) of mRNA for P450aromatase (b), ERα (c), ERβ (d) in mouse testes (bd) and MA-10 Leydig cells (fh), determined using real-time RT-PCR analysis 2 − ΔCt method. As an intrinsic control, the tubulin α1a mRNA level was measured in the samples [(a, e) -qualitative expression]. RQ is expressed as means ± SD. Asterisks show significant differences between control mice and those treated with G-15 (50 μg/kg bw) and control MA-10 Leydig cells and treated with G-15 (10 nM), ICI (ICI 182,780; 10 μM), E2 (17β-estradiol; 10 nM) alone and in combination for 24 h. Values are denoted as p < 0.05, ∗∗ p < 0.01 and ∗∗∗ p < 0.001. From each animal, at least three samples were measured. Samples of cultured Leydig cells were measured in triplicate
Fig. 8
Fig. 8
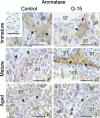
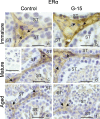
Effect of GPER blockage on aromatase and estrogen receptors localization in mouse testes. Representative microphotographs of testicular sections of control and G-15 (50 μg/kg bw)-treated immature, mature and aged mice. af Localization of P450aromatase; dashed lines (af) mark the periphery of seminiferous tubules (ST). Immunostaining with DAB and counterstaining with hematoxylin. Scale bars represent 15 μm. Immunoreaction was performed on testicular serial sections from at least three animals of each experimental group. No changes in expression of aromatase in testes of immature males after G-15 treatment in comparison to control are seen (arrows) (a, b). Increase of aromatase expression is visible in Leydig cells of mature G-15 males while its expression is very weak in control ones (arrows) (c, d). In negative controls, no positive staining is seen (inserts a). No differences between expression of aromatase are visible in control and G-15 aged mice (e, f). In negative controls, no positive staining is seen
Fig. 9
Fig. 9
Effect of GPER blockage on aromatase and estrogen receptors localization in mouse testes. Representative microphotographs of testicular sections of control and G-15 (50 μg/kg bw)-treated immature, mature and aged mice. (af) Localization of ERα. Expression of aromatase in both groups is moderate. Slight increase in ERα expression in nuclei and partially in cytoplasm of Leydig cell is observed in G-15 immature mice (arrows) (a, b). In both mature and aged mice (control and G-15-treated) no changes in expression of ERα is seen (arrows) (cf). In negative controls, no positive staining is seen (inserts c). The immunoexpression in cytoplasm and nuclei of Leydig cells is strong in mature males while it is moderate in aged ones (arrows) (cf)
Fig. 10
Fig. 10
Effect of GPER blockage on aromatase and estrogen receptors localization in mouse testes. Representative microphotographs of testicular sections of control and G-15 (50 μg/kg bw)-treated immature, mature and aged mice. Localization of ERβ (af) in testes of control and G-15-treated mice, respectively. Slight decrease in ERβ expression is observed in cytoplasm of immature males when compared to control whose expression is strong (arrows) (a, b). Moderate in control mature and weak in G-15 mature males expression of ERβ is revealed exclusively in cytoplasm of Leydig cells (arrows) (c, d). In control aged males, moderate cytoplasmic expression of ERβ is seen (arrows) (e) but is nuclear in a few Leydig cells of G-15 males (arrows) (f). In negative controls, no positive staining is seen (inserts e). Immunoreaction was performed on testicular serial sections from at least three animals of each experimental group
Fig. 11
Fig. 11
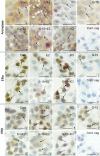
Effect of GPER blockage on localization of aromatase and estrogen receptors in Leydig cells in vitro. Representative microphotographs of control MA-10 Leydig cells (a, i, q), E2 (17-β estradiol; 10 nM) (b, j, r), ICI (ICI 182,780; 10 μM) (c, k, s), G-15 (10 nM) (d, l, t), ICI +E2 (e, m, u), G-15+E2 (f, n, v), G-15+ ICI (g, o, w)-treated Leydig cells for 24 h. (ag) Localization of P450aromatase; (io) localization of ERα; localization of ERβ (qw) in control and G-15-treated Leydig cells. Immunostaining with DAB and counterstaining with hematoxylin. Scale bars represent 20 μm. Cultures of Leydig cells from each experimental group were analyzed in triplicate. Weak to moderate aromatase immunoreaction is seen in the cytoplasm of control Leydig cells (arrows) (a). Increase of its expression is visible after E2 treatment (arrows) (b). After treatment with ICI weak staining while moderate after G-15 treatment is seen (arrows) (c, d). After combinations of ICI with E2, G-15 with E2 and G-15 with ICI strong to moderate aromatase expression in a majority of treated cells is seen (arrows) (eg). Strong immunoexpression of ERα is observed in nuclei of control Leydig cells (arrows) (i). After treatment with both E2 and ICI strong nuclear immunostaining is present in a minority of cells (arrows) (j, k). After G-15 treatment weak immunostaining in single Leydig cells is visible (arrows), (l) which is not the case in cells treated with ICI together with E2 or G-15 (arrows) (m, o). In cells treated with G-15 together with E2 moderate to strong cytoplasmic immunostaining is seen (arrow) (n). Moderate expression of ERβ in a majority of nuclei of control Leydig cells is observed (arrows) (q). Increased after E2 treatment immunostaining of ERβ is visible in nuclei of a majority of cells (r). In a few cells staining is cytoplasmic (short arrow) (r). In a majority of ICI - treated cells the ERβ staining is weak (arrows) (s) while after exposure to G-15 and ICI with E2 staining is of strong to moderate intensity and located in nuclei of a majority of cells (arrows) (t, u). After treatment with G-15 and E2 in combination mainly cytoplasmic staining for ERβ is observed (arrows) (v). Moderate to weak nuclear ERβ staining is visible after G-15 and ICI exposure (arrows) (w). In negative controls, no positive staining is seen (inserts h, p, x)
Fig. 12
Fig. 12
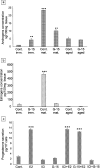
Effect of GPER on sex steroid concentration in mouse testes and secretion by Leydig cells in vitro. Androgens and estrogens concentration in testes of immature, mature and aged mice control and G-15-treated (a, b) and progesterone secretion in MA-10 Leydig cells (c) control and G-15, E2 and ICI-treated alone and in combination. Data are expressed as means ± SD. From each animal, at least three samples were measured. Culture media were measured in triplicate. Asterisks show significant differences in testosterone and estradiol concentrations between control and G-15 (50 μg/kg bw)-treated males and in progesterone secretion between control MA-10 Leydig cells and those treated with G-15 (10 nM), ICI (ICI 182,780; 10 μM), E2 (17β-estradiol; 10 nM) alone and in combination for 24 h. Values are denoted as ∗∗p < 0.01 and ∗∗∗p < 0.001

Similar articles

Cited by

References

    1. Abney TO. The potential roles of estrogens in regulating Leydig cell development and function: a review. Steroids. 1999;64(9):610–617. - PubMed
    1. Abney TO, Myers RB. 17 beta-estradiol inhibition of Leydig cell regeneration in the ethane dimethylsulfonate-treated mature rat. J Androl. 1991;12(5):295–304. - PubMed
    1. Abraham GE, Swerdloff ES, Tulchinsky D, Odell WD. Radioimmunoassay of plasma 17-hydroxyprogesterone. J Clin Endocrinol. 1971;33:42–46. - PubMed
    1. Acconcia Filippo, Fiocchetti Marco, Marino Maria. Xenoestrogen regulation of ERα/ERβ balance in hormone-associated cancers. Molecular and Cellular Endocrinology. 2017;457:3–12. - PubMed
    1. Alarid ET, Bakopoulos N, Solodin N. Proteasome-mediated proteolysis of estrogen receptor: a novel component in autologous down-regulation. Mol Endocrinol. 1999;13:1522–1534. - PubMed

MeSH terms

LinkOut - more resources