

HMeta-d: hierarchical Bayesian estimation of metacognitive efficiency from confidence ratings
- PMID: 29877507
- PMCID: PMC5858026
- DOI: 10.1093/nc/nix007
HMeta-d: hierarchical Bayesian estimation of metacognitive efficiency from confidence ratings
Abstract
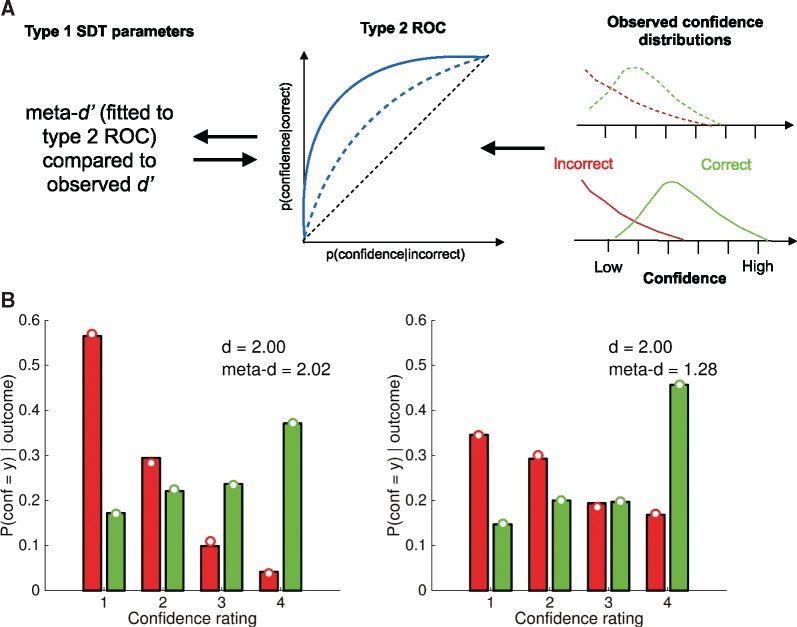
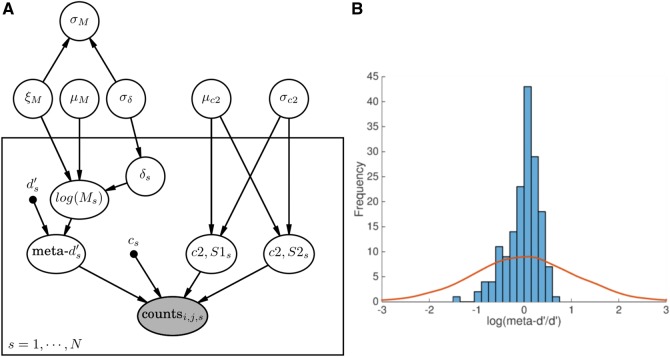
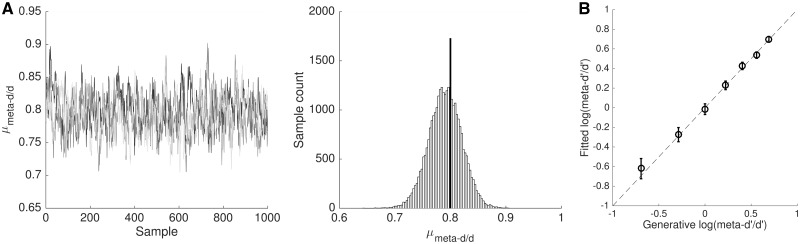
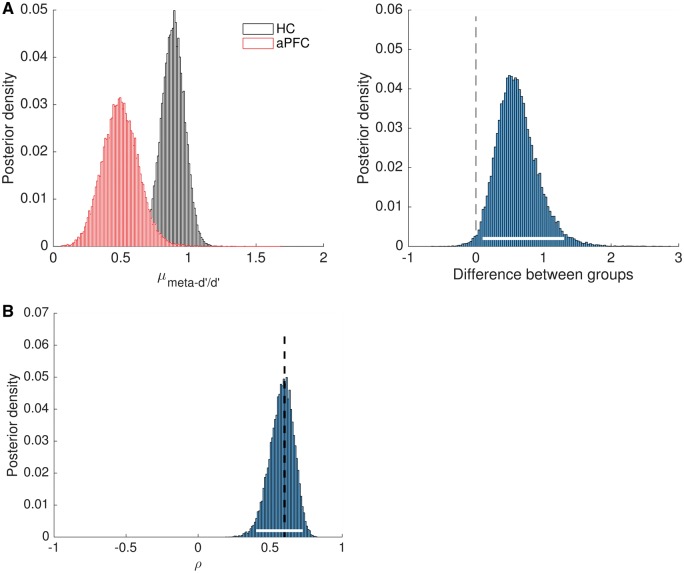
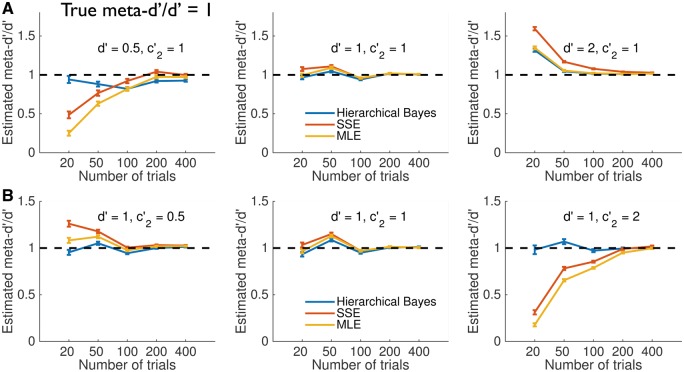
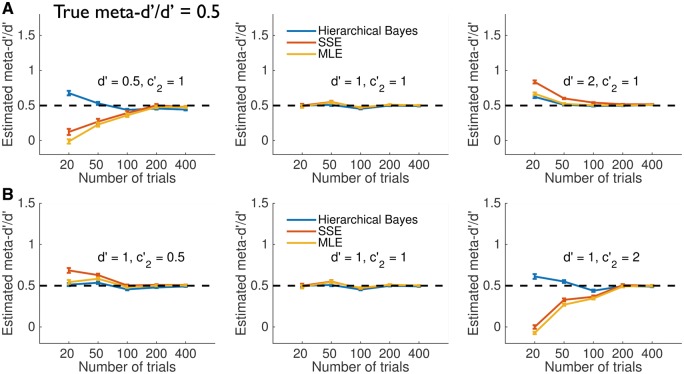
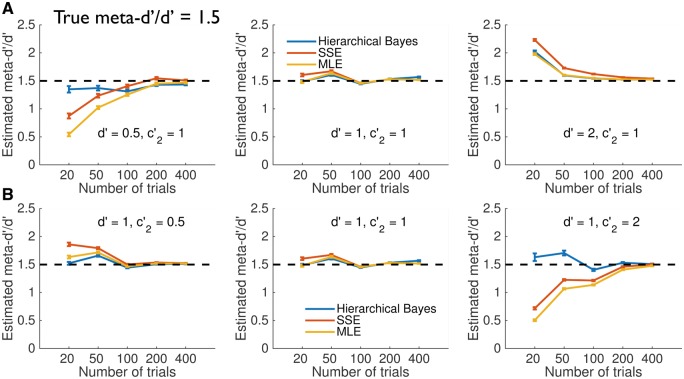
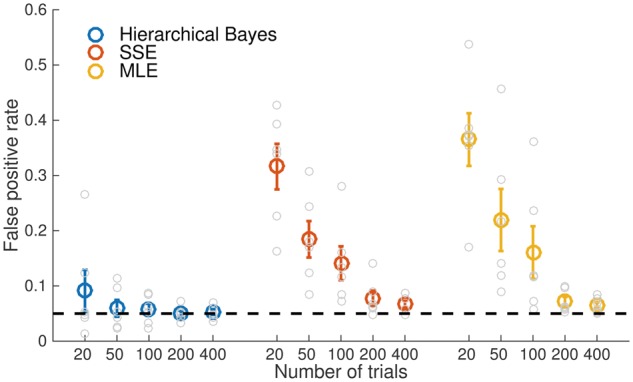
Metacognition refers to the ability to reflect on and monitor one's cognitive processes, such as perception, memory and decision-making. Metacognition is often assessed in the lab by whether an observer's confidence ratings are predictive of objective success, but simple correlations between performance and confidence are susceptible to undesirable influences such as response biases. Recently, an alternative approach to measuring metacognition has been developed (Maniscalco and Lau 2012) that characterizes metacognitive sensitivity (meta-d') by assuming a generative model of confidence within the framework of signal detection theory. However, current estimation routines require an abundance of confidence rating data to recover robust parameters, and only provide point estimates of meta-d'. In contrast, hierarchical Bayesian estimation methods provide opportunities to enhance statistical power, incorporate uncertainty in group-level parameter estimates and avoid edge-correction confounds. Here I introduce such a method for estimating metacognitive efficiency (meta-d'/d') from confidence ratings and demonstrate its application for assessing group differences. A tutorial is provided on both the meta-d' model and the preparation of behavioural data for model fitting. Through numerical simulations I show that a hierarchical approach outperforms alternative fitting methods in situations where limited data are available, such as when quantifying metacognition in patient populations. In addition, the model may be flexibly expanded to estimate parameters encoding other influences on metacognitive efficiency. MATLAB software and documentation for implementing hierarchical meta-d' estimation (HMeta-d) can be downloaded at https://github.com/smfleming/HMeta-d.
Keywords: Bayes; confidence; metacognition; signal detection theory.
Figures
Similar articles
-
Metacognition in functional cognitive disorder.Brain Commun. 2022 Feb 22;4(2):fcac041. doi: 10.1093/braincomms/fcac041. eCollection 2022. Brain Commun. 2022. PMID: 35243345 Free PMC article.
-
Are the contributions of processing experience and prior beliefs to confidence ratings domain-general or domain-specific?J Exp Psychol Gen. 2023 Jan;152(1):28-44. doi: 10.1037/xge0001257. Epub 2022 Jun 16. J Exp Psychol Gen. 2023. PMID: 35708950
-
Evidence for Age-Equivalent and Task-Dissociative Metacognition in the Memory Domain.Front Psychol. 2021 Feb 5;12:630143. doi: 10.3389/fpsyg.2021.630143. eCollection 2021. Front Psychol. 2021. PMID: 33633653 Free PMC article.
-
How to measure metacognition.Front Hum Neurosci. 2014 Jul 15;8:443. doi: 10.3389/fnhum.2014.00443. eCollection 2014. Front Hum Neurosci. 2014. PMID: 25076880 Free PMC article. Review.
-
Optimal metacognitive decision strategies in signal detection theory.Psychon Bull Rev. 2025 Jun;32(3):1041-1069. doi: 10.3758/s13423-024-02510-7. Epub 2024 Nov 18. Psychon Bull Rev. 2025. PMID: 39557811 Free PMC article. Review.
Cited by
-
Effects of ketamine on brain function during metacognition of episodic memory.Neurosci Conscious. 2021 Feb 10;2021(1):niaa028. doi: 10.1093/nc/niaa028. eCollection 2021. Neurosci Conscious. 2021. PMID: 33747545 Free PMC article.
-
Behavioral and neural measures of confidence using a novel auditory pitch identification task.PLoS One. 2024 Jul 1;19(7):e0299784. doi: 10.1371/journal.pone.0299784. eCollection 2024. PLoS One. 2024. PMID: 38950011 Free PMC article.
-
Judgments of agency are affected by sensory noise without recruiting metacognitive processing.Elife. 2022 Jan 20;11:e72356. doi: 10.7554/eLife.72356. Elife. 2022. PMID: 35049503 Free PMC article.
-
Respiration, Heartbeat, and Conscious Tactile Perception.J Neurosci. 2022 Jan 26;42(4):643-656. doi: 10.1523/JNEUROSCI.0592-21.2021. Epub 2021 Dec 1. J Neurosci. 2022. PMID: 34853084 Free PMC article.
-
Knowing that you know that you know? An extreme-confidence heuristic can lead to above-chance discrimination of metacognitive performance.Neurosci Conscious. 2024 May 22;2024(1):niae020. doi: 10.1093/nc/niae020. eCollection 2024. Neurosci Conscious. 2024. PMID: 38779689 Free PMC article.
References
-
- Ais J, Zylberberg A, Barttfeld P, et al. Individual consistency in the accuracy and distribution of confidence judgments. Cognition 2016;146:377–86. http://doi.org/10.1016/j.cognition.2015.10.006 - DOI - PubMed
-
- Baird B, Smallwood J, Gorgolewski KJ, et al. Medial and lateral networks in anterior prefrontal cortex support metacognitive ability for memory and perception. J Neurosci 2013;33:16657–65. http://doi.org/10.1523/JNEUROSCI.0786-13.2013 - DOI - PMC - PubMed
-
- Barrett AB, Dienes Z, Seth AK.. Measures of metacognition on signal-detection theoretic models. Psychol Methods 2013;18:535–52. http://doi.org/10.1037/a0033268 - DOI - PubMed
-
- Charles L, Van Opstal F, Marti S, et al. Distinct brain mechanisms for conscious versus subliminal error detection. NeuroImage 2013;73:80–94. http://doi.org/10.1016/j.neuroimage.2013.01.054 - DOI - PMC - PubMed
-
- Clarke F, Birdsall T, Tanner W.. Two types of ROC curves and definition of parameters. J Acoust Soc Am 1959;31:629–30.
Grants and funding
LinkOut - more resources
Full Text Sources
Other Literature Sources
Miscellaneous