. 2018 Sep;146(6):735-752.
doi: 10.1111/jnc.14482. Epub 2018 Aug 16.

Intracellular sorting and transcytosis of the rat transferrin receptor antibody OX26 across the blood-brain barrier in vitro is dependent on its binding affinity

Affiliations

Intracellular sorting and transcytosis of the rat transferrin receptor antibody OX26 across the blood-brain barrier in vitro is dependent on its binding affinity

Arsalan S Haqqani et al. J Neurochem. 2018 Sep.

Abstract

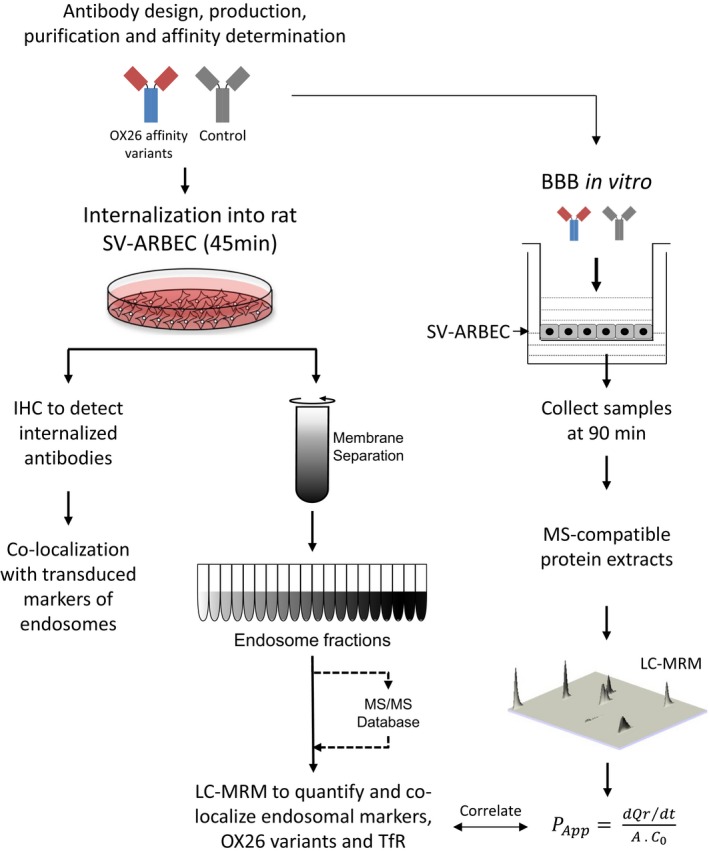
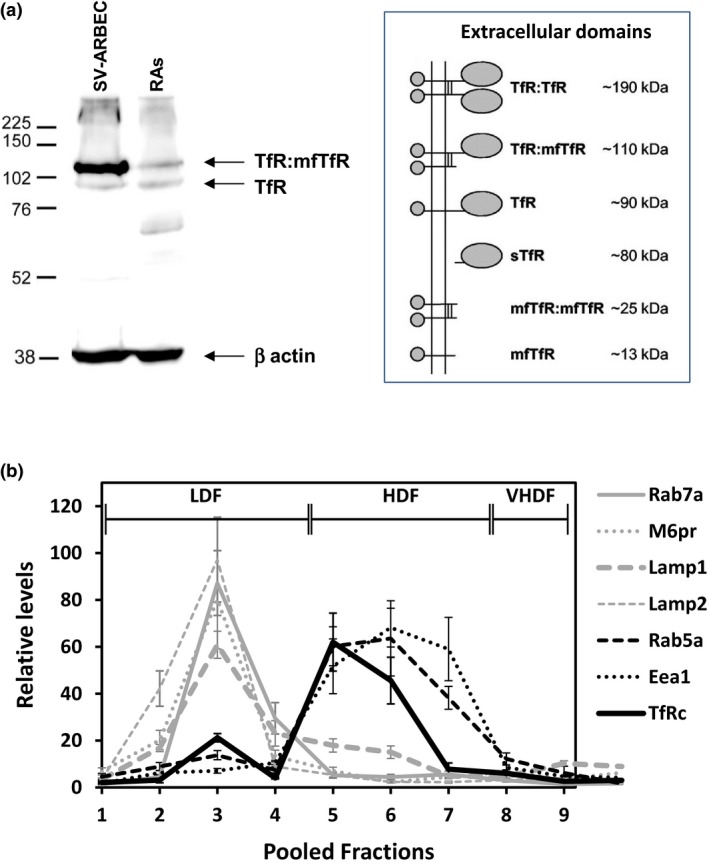
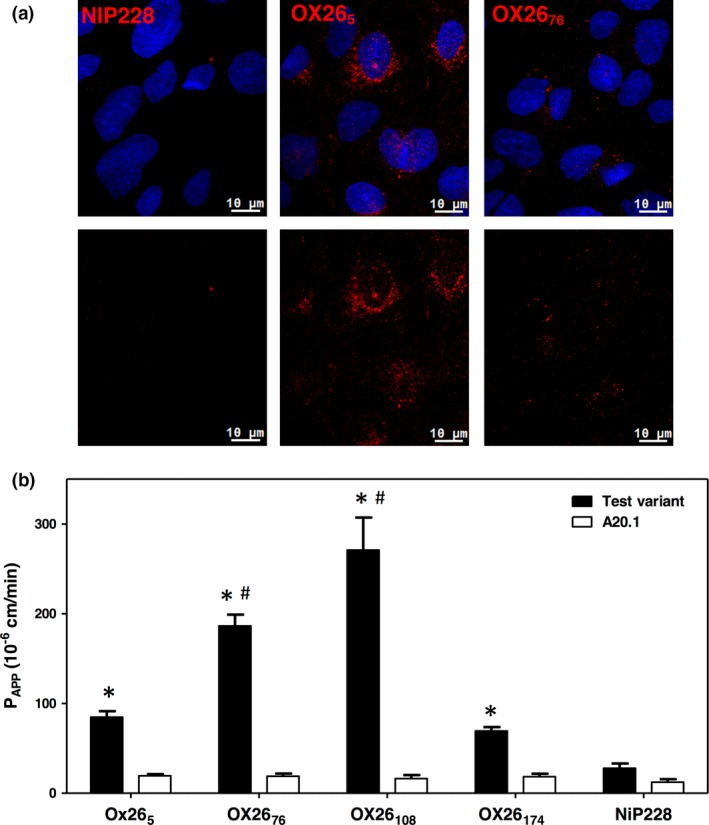
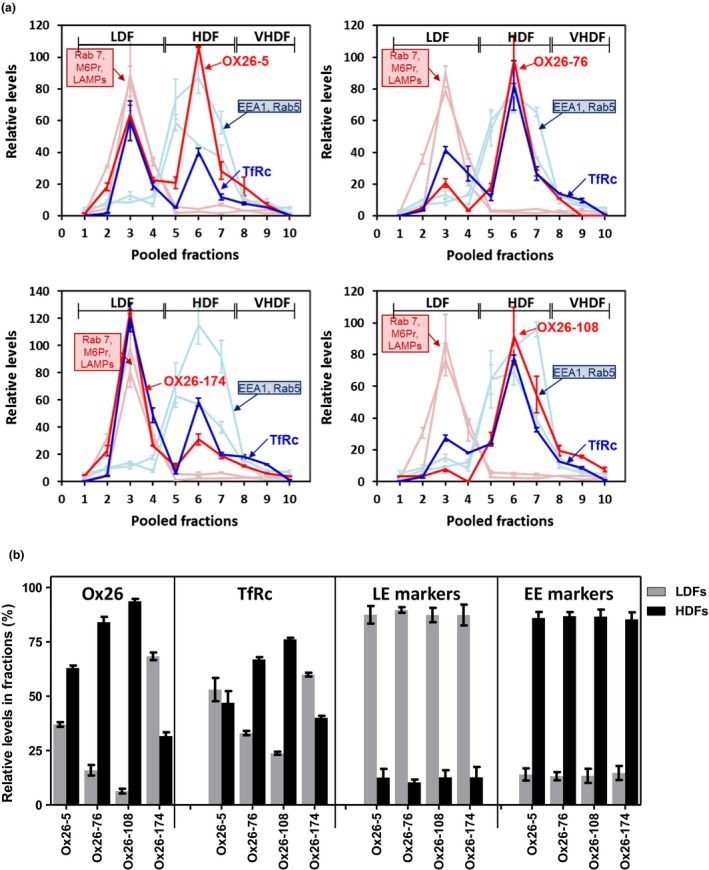
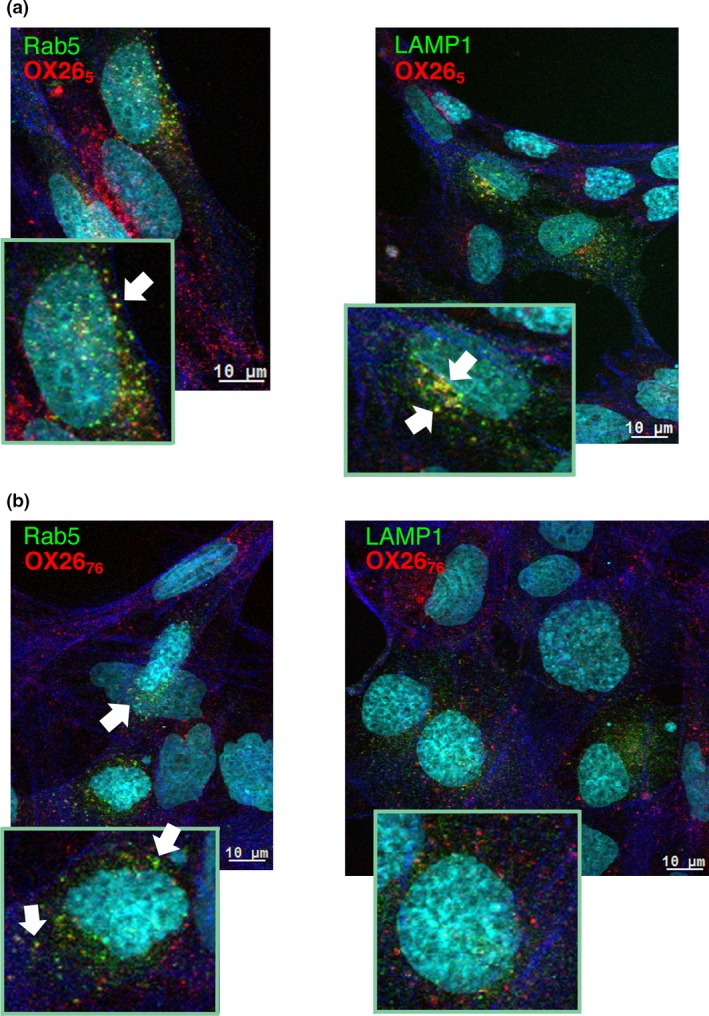
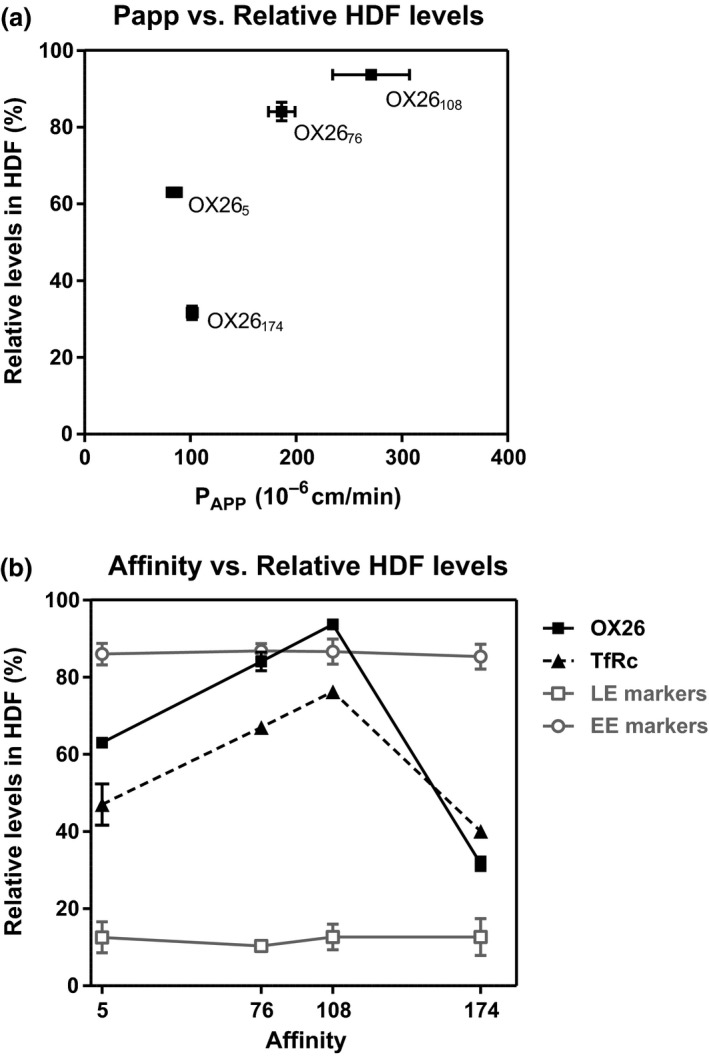
The blood-brain barrier (BBB) is a formidable obstacle to the delivery of therapeutics to the brain. Antibodies that bind transferrin receptor (TfR), which is enriched in brain endothelial cells, have been shown to cross the BBB and are being developed as fusion proteins to deliver therapeutic cargos to brain targets. Various antibodies have been developed for this purpose and their in vivo evaluation demonstrated that either low affinity or monovalent receptor binding re-directs their transcellular trafficking away from lysosomal degradation and toward improved exocytosis on the abluminal side of the BBB. However, these studies have been performed with antibodies that recognize different TfR epitopes and have different binding characteristics, preventing inter-study comparisons. In this study, the efficiency of transcytosis in vitro and intracellular trafficking in endosomal compartments were evaluated in an in vitro BBB model for affinity variants (Kd from 5 to174 nM) of the rat TfR-binding antibody, OX26. Distribution in subcellular fractions of the rat brain endothelial cells was determined using both targeted quantitative proteomics-selected reaction monitoring and fluorescent imaging with markers of early- and late endosomes. The OX26 variants with affinities of 76 and 108 nM showed improved trancytosis (Papp values) across the in vitro BBB model compared with a 5 nM OX26. Although ~40% of the 5 nM OX26 and ~35% of TfR co-localized with late-endosome/lysosome compartment, 76 and 108 nM affinity variants showed lower amounts in lysosomes and a predominant co-localization with early endosome markers. The study links bivalent TfR antibody affinity to mechanisms of sorting and trafficking away from late endosomes and lysosomes, resulting in improvement in their transcytosis efficiency.

Open practices: Open Science: This manuscript was awarded with the Open Materials Badge. For more information see: https://cos.io/our-services/open-science-badges/ Cover Image for this issue: doi: 10.1111/jnc.14193.

Keywords: affinity optimization; blood-brain barrier; intracellular trafficking; quantitative targeted proteomics; transferrin receptor antibody.


Figures

Figure 1
Figure 1
A schematic outlining the experimental design of the study. Antibodies were characterized for their internalization into rat BEC cell line, SV‐ARBEC, and their co‐localization with markers of early and late endosomes was determined using immunofluorescence methods. Cells were fractionated and each fraction was analyzed by nanoLC‐MRM to quantify the levels of: internalized antibodies, TfR, and markers of early and late endosomes. The antibodies were then evaluated for their ability to traverse SV‐ARBEC monolayer in transwells in vitro. Apparent peramebility coefficients (Papp) were calculated for each antibody. Levels of the antibodies measured in early‐endosome‐ and late‐endosome/lysosome ‐containing compartments of SV‐ARBEC was then correlated with their Papp values.
Figure 2
Figure 2
The expression and distribution of the transferrin receptor in cellular fractions of the immortalized rat brain endothelial cells (SV‐ARBEC). (a) Detection of the TfR by western blot in whole cell extracts of SV‐ARBEC and rat astrocytes (RAs) using pan‐specific rat‐human anti‐TfR antibody. The blot is representative of the n = 3 separate experiments. The schematic on the left hand side, adapted from (Kaup et al. 2002), shows different forms of the TfR detected in cells (sTfR is cleaved by membrane proteases; all other forms are membrane‐attached). Both SV‐ARBEC and RAs express TfR:mTfR (110kD) and TfR (90 kD) form of the receptor. (b) Relative levels of TfR, markers of early endosomes (Rab5a, EEA1) and markers of late endosomes (Rab7, Lamp1, Lamp2. M6pr) in cellular fractions of SV‐ARBECs quantified using multiplexed LC‐SRM. Shown are relative abundances (mean ± SD; n = 4 separate experiments) of protein‐specific peptides from three endosome preparations. Fractions 1‐4 are designated low‐density fractions (LDFs); fractions 5‐7 high‐density fractions (HDFs); fractions 8‐10 very high‐density fractions (vHDFs).
Figure 3
Figure 3
Internalization and transcytosis of OX26 antibody affinity variants in rat model of the blood–brain barrier (BBB) in vitro. (a) SV‐ARBEC cells were exposed to fluorescently labeled control antibody NiP228, or OX265, or OX2676 for 45 min and internalization of the antibody was assessed by fluorescent microscopy. Fluorescent images in upper panels are fusion of red (antibody) and blue channels (cell nuclei counter‐stained by Hoechst); bottom images show red signal of the antibody. (b) Apparent permeability coefficient (Papp) of OX26 affinity variants and the control antibody NiP228 in SV‐ARBEC BBB model in vitro. Single‐domain antibody A20.1 was used in each transwell insert as an ‘in‐experiment’ control for the monolayer permeability. Results are shown as Mean ± SD for n = 6 independent transwell inserts. Asterisks (*) indicate < 0.01 compared to NiP228; number signs (#) indicate < 0.01 compared to OX265 (one‐way anova followed by Dunnet's post hoc comparison of means).
Figure 4
Figure 4
Co‐localization of OX26 affinity variants and TfR with markers of early and late endosomes/lysosomes in subcellular fractions of SV‐ARBEC cells. (a) Cells were exposed to 0.3 μM of either one of OX26 affinity variants for 45 min, fractionated and analyzed by multiplexed LC‐SRM. Graphs show relative levels of the OX26 variant (solid black lines), TfR (dashed black lines), markers of early endosomes (Rab5a, Eea1) (dashed gray lines) and markers of late endosomes (Rab7, Lamp1, Lamp2) (solid gray lines) in each cellular fraction. Fractions 1‐4 are designated low‐density fractions (LDFs); fractions 4‐8 high‐density fractions (HDFs); fractions 8‐10 very high‐density fractions (vHDFs). For OX26 variants, absolute levels were measured (using calibration curve and ILIS), whereas for other proteins only relative intensities were measured. Since MS intensities cannot be compared among different proteins but intensities of a same protein can be compared among different samples (fractions), all intensities were normalized to a constant total intensity and overlaid to allow comparison of relative levels of different proteins among different fractions. Shown are average intensities (± SD) of protein‐specific peptides from three biologically independent endosome preparations. Absolute levels of internalized OX26 antibodies were as follows: OX265: 67.2 ± 3.1 amol; OX2676: 25.9 ± 4.7 amol; OX26108: 26.3 ± 2.1 amol; OX26174: 9.48 ± 1.8 amol. (b) Bar graph showing composite relative abundance (AUC; mean ± SD from n = 3 independent experiments/endosome preparations) of OX26 affinity variants, TfR and markers of late and early endosomes in LDFs and HDFs in each experimental condition shown in A. For ‘OX26’ and ‘TfRc’ panels, asterisks (*) indicate p < 0.01 compared to OX265 LDFs; number signs (#) indicate p < 0.01 compared to OX265 HDFs; ampersand (&) indicate p < 0.05 compared to OX265 HDFs (one‐way anova followed by Dunnett post hoc comparison of means). For the ‘LE markers’ and ‘EE markers’ panels, asterisks (*) indicate p < 0.01 compared to respective LDFs (one‐way anova followed by Dunnett post hoc comparison of means).
Figure 5
Figure 5
Co‐localization of AF680‐labeled (red) OX265 (a) and OX2676 (b) with endosome markers in RFP‐Rab5 (left panels) and RFP‐Lamp‐1 (right panels) (both in green) – transduced SV‐ARBEC. Actin filaments labeled with Alexa Fluor 488 Phalloidin are shown in blue. Nuclei are labeled with Hoechst (shown in turquoise). Cells were transduced and internalization studies performed as described in Materials and methods. Micrographs are representative of n = 3 independent experiments.
Figure 6
Figure 6
Relationship between OX26 variant binding affinities, their distribution in HDFs (early endosomes) and transcytosis across the blood–brain barrier (BBB) model in vitro. (a) Papp values versus percent distribution into HDFs of OX26 affinity variants. (b) Affinity versus percent distribution into HDFs of OX26 affinity variants. The relative distribution of the TfR, as well as early endosome (EE) and late endosome (LE) markers in cells exposed to each OX26 affinity variant is also shown.
Figure 7
Figure 7
TfR levels in SV‐ARBEC after a 48‐h exposure to OX26 affinity variants. The TfR expression levels were determined by western blot as described in Materials and methods. (a) Gels shown are representative of three separate experiments. (b) Relative densities of each TfR‐specific band versus loading control β‐actin were determined and shown as mean ± SD (n = 3 separate western blots). Asterisks indicate a significant difference (p < 0.01, one‐way anova followed by Dunnett pot hoc comparison among means) compared to a corresponding band in cells under basal condition.

Similar articles

Cited by

References

    1. Ahn J. and Johnstone R. M. (1993) Origin of a soluble truncated transferrin receptor. Blood 81, 2442–2451. - PubMed
    1. Artursson P. and Karlsson J. (1991) Correlation between oral drug absorption in humans and apparent drug permeability coefficients in human intestinal epithelial (Caco‐2) cells. Biochem. Biophys. Res. Commun. 175, 880–885. - PubMed
    1. Bien‐Ly N., Yu Y. J., Bumbaca D. et al (2014) Transferrin receptor (TfR) trafficking determines brain uptake of TfR antibody affinity variants. J. Exp. Med. 211, 233–244. - PMC - PubMed
    1. Cabezon I., Manich G., Martin‐Venegas R., Camins A., Pelegri C. and Vilaplana J. (2015) Trafficking of gold nanoparticles coated with the 8D3 anti‐transferrin receptor antibody at the mouse blood‐brain barrier. Mol. Pharm. 12, 4137–4145. - PubMed
    1. Chan L. N. and Gerhardt E. M. (1992) Transferrin receptor gene is hyperexpressed and transcriptionally regulated in differentiating erythroid cells. J. Biol. Chem. 267, 8254–8259. - PubMed

MeSH terms

Grants and funding