. 2018 Nov 1;198(9):1208-1219.
doi: 10.1164/rccm.201711-2333OC.

Drug-Penetration Gradients Associated with Acquired Drug Resistance in Patients with Tuberculosis

Affiliations

Drug-Penetration Gradients Associated with Acquired Drug Resistance in Patients with Tuberculosis

Keertan Dheda et al. Am J Respir Crit Care Med. .

Abstract

Rationale: Acquired resistance is an important driver of multidrug-resistant tuberculosis (TB), even with good treatment adherence. However, exactly what initiates the resistance and how it arises remain poorly understood.

Objectives: To identify the relationship between drug concentrations and drug susceptibility readouts (minimum inhibitory concentrations [MICs]) in the TB cavity.

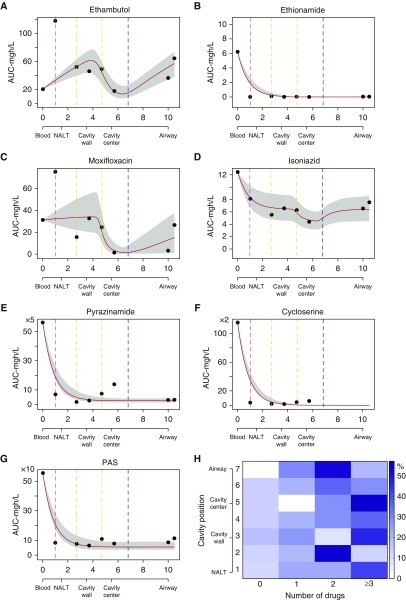
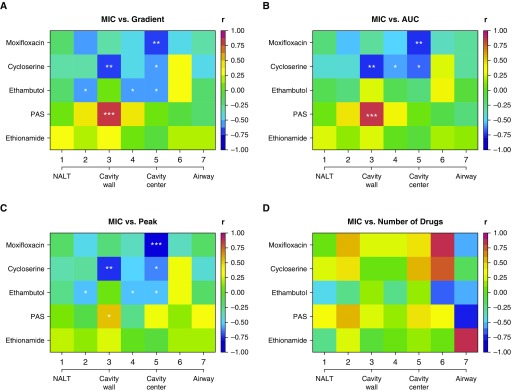
Methods: We recruited patients with medically incurable TB who were undergoing therapeutic lung resection while on treatment with a cocktail of second-line anti-TB drugs. On the day of surgery, antibiotic concentrations were measured in the blood and at seven prespecified biopsy sites within each cavity. Mycobacterium tuberculosis was grown from each biopsy site, MICs of each drug identified, and whole-genome sequencing performed. Spearman correlation coefficients between drug concentration and MIC were calculated.

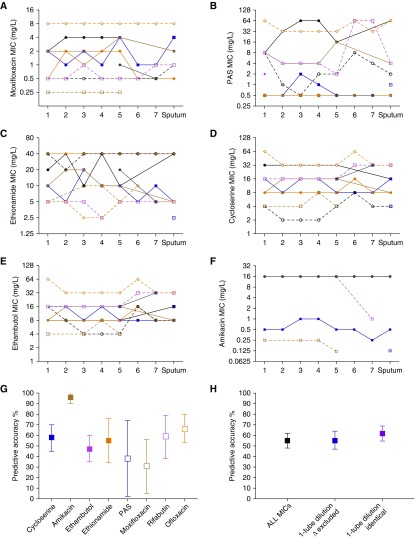
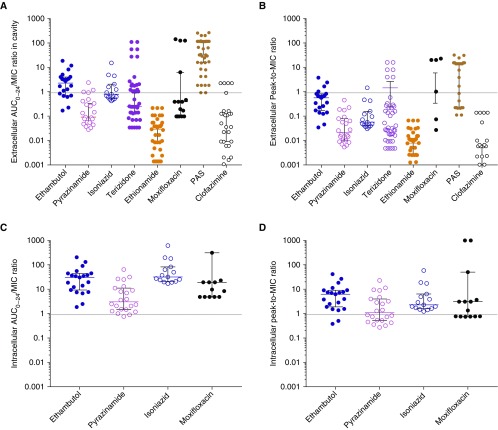
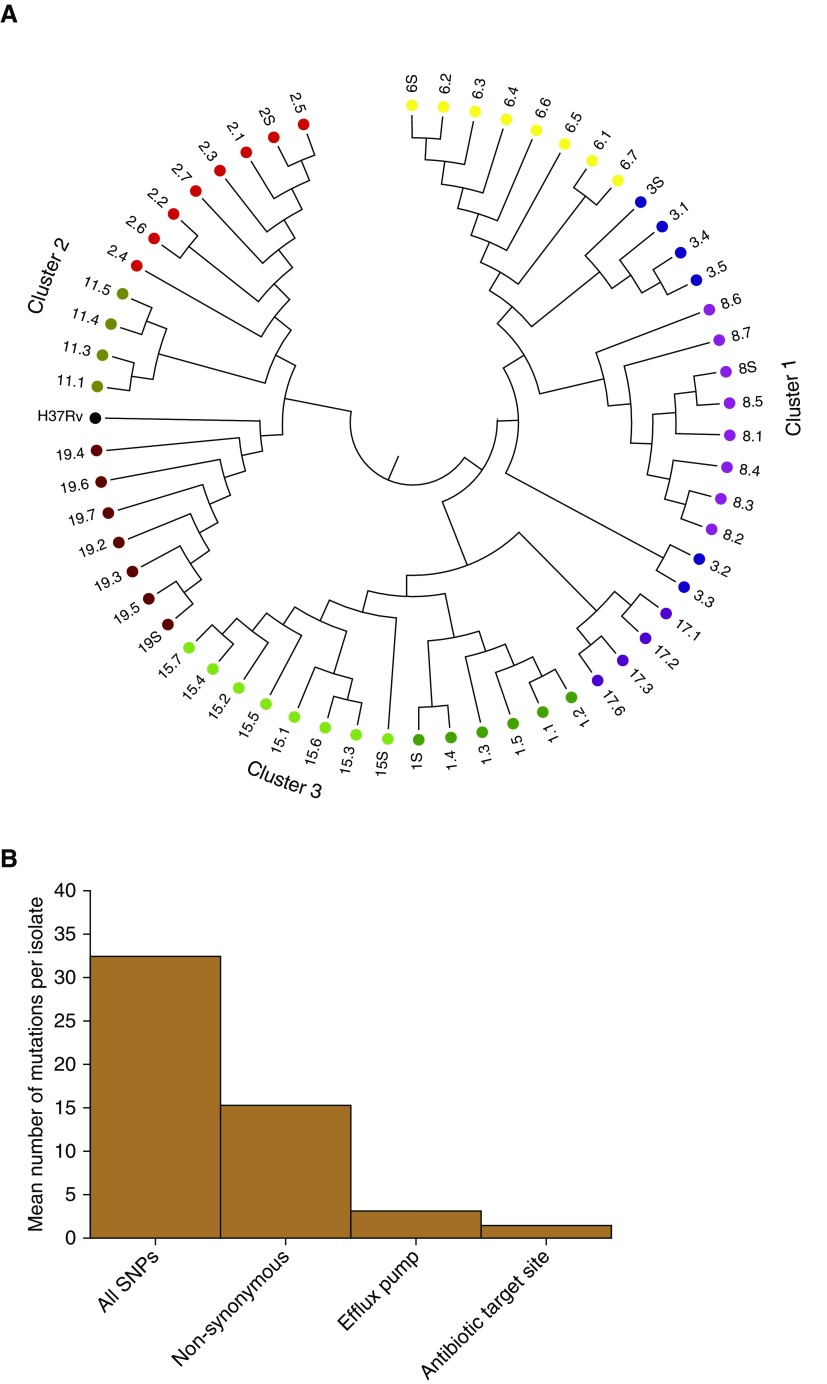
Measurements and main results: Fourteen patients treated for a median of 13 months (range, 5-31 mo) were recruited. MICs and drug resistance-associated single-nucleotide variants differed between the different geospatial locations within each cavity, and with pretreatment and serial sputum isolates, consistent with ongoing acquisition of resistance. However, pretreatment sputum MIC had an accuracy of only 49.48% in predicting cavitary MICs. There were large concentration-distance gradients for each antibiotic. The location-specific concentrations inversely correlated with MICs (P < 0.05) and therefore acquired resistance. Moreover, pharmacokinetic/pharmacodynamic exposures known to amplify drug-resistant subpopulations were encountered in all positions.

Conclusions: These data inform interventional strategies relevant to drug delivery, dosing, and diagnostics to prevent the development of acquired resistance. The role of high intracavitary penetration as a biomarker of antibiotic efficacy, when assessing new regimens, requires clarification.

Keywords: acquired drug resistance; drug gradient; lung cavity; sputum MIC; whole-genome sequencing.


Figures

Figure 1.
Figure 1.
Number of drugs and concentration gradient in a dynamical sink model. (AG) Data points (circles) are mean area under the concentration–time curve (AUC) values at that cavity position, and the shaded area indicates 95% confidence intervals fitting to a dynamical sink model. The x-axis is distance in centimeters; we also include a description of cavity position on each x-axis. The colored vertical lines mark transition zones/boundaries between adjacent histopathological regions on the second x-axis. The y-axis is the 0- to 24-hour AUC in mg · h/L. For (A) ethambutol, (C) moxifloxacin, and (D) isoniazid, the potential “well” of the sink is at the air–caseum interface (marked “cavity center” in figure), and the shape suggests two directions of diffusion from outside the cavity and also directly into airways. For (B) ethionamide, (E) pyrazinamide, (F) cycloserine, and (G) para-aminosalicylic acid (PAS), there is steep decline, consistent with concentration declining inversely proportional to an exponent of the distance from the source. (H) Heat map showing the effective number of drugs at each location. The percentage of patients with the number of drugs at each position is shown by shades of blue (scale); as an example, in position 7 (airway) 50% of patients had two effective drugs (deep blue). The heat map shows the heterogeneity in drug penetration into each geospatial location. The number of effective drugs by cavity position using each of the three definitions is shown in Figure E4. NALT = normal-appearing lung tissue.
Figure 2.
Figure 2.
Minimum inhibitory concentration (MIC) in sputum and by cavity position. (AF) MICs of isolates from each patient are joined by a line to allow easy tracing across the tuberculosis cavity. Some of the lines for different patients overlapped. There were differences in MIC by greater than one-tube dilution in many instances. If standard critical concentrations are used to categorize “resistant” from “susceptible,” it can be seen for that for (A) moxifloxacin (0.5 or 2.0 mg/L), (B) para-aminosalicylic acid (PAS) (2.0 mg/L), (C) ethionamide (5.0 mg/L), (D) cycloserine (10/40 mg/L), (E) ethambutol (5.0/10 mg/L), and (F) amikacin (4.0 mg/L), there was a considerable proportion of patients with both drug-susceptible and drug-resistant isolates at the same time. (G and H) The square indicates the mean estimates, and bars indicate 95% confidence intervals. For each drug, we examined how accurate the sputum MIC value was in predicting the MIC of Mycobacterium tuberculosis isolates inside that patient’s single cavity. We tested isolates in one cavity from each patient, although most patients had more than one cavity.
Figure 3.
Figure 3.
Correlation of minimum inhibitory concentration (MIC) with drug parameters by cavity geospatial position. The cavity center denotes the air–caseum interface. We examined for both Pearson and Spearman correlations, as well as the Kendall tau. Results are for Spearman r. P values are encoded as not significant if ≥0.05. *P < 0.05, **P < 0.01, and ***P < 0.001. (A) The relationship of MIC to gradient, in this case expressed as the ratio of area under the concentration–time curve (AUC) at the cavity position to the AUC in the blood, shows a moderate to high negative correlation with MIC (i.e., darker blue) for all drugs except ethionamide and in several positions for para-aminosalicylic acid (PAS). For PAS, the significant P values are for a positive correlation between MIC and concentration. (B) The relationship between actual 0- to 24-hour AUC (mg · h/L) and MIC shows strong negative r for the drugs, except for PAS. (C) Similar findings are noted when peak concentration was used as drug concentration. These negative correlations shown in A–C indicate that high MIC (drug resistance) was associated with low drug levels (gradient, peak, and/or AUC). (D) Shows complex correlation patterns for number of drugs versus MIC. In general, the correlation between number of drugs and MIC was low, and no position had correlation associated with a P < 0.05. This means, surprisingly, that spatial monotherapy, or even dual therapy, was the least strongly correlated with acquired drug resistance, likely because eight or more drugs were administered. NALT = normal-appearing lung tissue.
Figure 4.
Figure 4.
Pharmacodynamic exposures achieved inside tuberculosis cavities. Exposure ratios were derived from the measured area under the concentration–time curve (AUC) and minimum inhibitory concentration (MIC) matched by biopsy position; extracellular and intracellular exposures were calculated for each position. In prior studies, the free drug exposures associated with resistance amplification were an ethambutol peak/MIC of less than 49 and AUC0–24/MIC < 272, a pyrazinamide percentage time above MIC < 67%, which translates to a peak/MIC < 2.5, or an AUC0–24/MIC < 43, an isoniazid peak/MIC < 150 and an AUC0–24/MIC < 700, and a moxifloxacin AUC0–24/MIC < 106 (–27, 29). (A) For the extracellular AUC/MIC ratios, the proportions of positions with exposures that have been demonstrated to amplify the population of drug-resistant mutants in the hollow fiber system model of tuberculosis were 100% for ethambutol, 100% for pyrazinamide, and 100% for isoniazid, but 80% for moxifloxacin. The hatched line indicates exposures above and below a ratio of 1. Although the resistance amplification ratios for the rest of the drugs are unknown, the median AUC0–24/MIC values of clofazimine (0.05), ethionamide (0.03), and cycloserine (terizidone, 0.25) mean that most values were below the MIC, except for para-aminosalicylic acid (PAS). (B) On the basis of the extracellular peak/MIC ratios, the proportions of positions with exposures that amplify drug-resistant subpopulations were 100% for all drugs. The median peak/MIC ratios for ethionamide (ratio = 0.008), cycloserine (ratio = 0.033), and clofazimine (ratio = 0.002) mean that these drugs had more peak concentrations below MIC, with the exception of PAS (ratio = 14). (C) Because of intracellular accumulation of the drugs, the AUC/MICs were in the resistance amplification range for 100% for ethambutol and isoniazid, 98% for pyrazinamide, and 73% for moxifloxacin. (D) For intracellular peak/MIC ratios, all ethambutol and isoniazid exposures were in the resistance amplification range, but for only 59% of pyrazinamide.
Figure 5.
Figure 5.
Whole-genome sequencing (WGS)-based variants in sputum and cavitary bacterial isolates. (A) WGS-based diversity of isolates revealed heterogeneity within each cavity, from patients who had more than two cavitary isolates that passed WGS quality control. Each color code indicates patient designation (also numbered), and the number (0.1, 0.2, 0.3, 0.4, 0.5, 0.6, 0.7, or S [sputum]) after the decimal indicates cavity positions specified in Figure E1. There were three clusters by relatedness and genetic distance; we give the position of the reference Mycobacterium tuberculosis H37Rv strain for context. As an example, sputum isolate 19.S differed from the neighbor 19.5 by 6 SNPs, shown by the bar height in the dendogram, whereas on the other extreme, 19.4 differed from 19.6 by 25 SNPs in the largest height for isolates in patient 19, within the same cavity. This shows much diversity of SNPs in each cavity; for the cavity in patient 3 (blue), there were two completely unrelated strains of different phylogenetic lineage. (B) y-axis shows the mean number of new mutations in the t = 1 isolate versus t = 0 isolate. Isolates from patients who had WGS of isolates before the current treatment episode (t = 0; time of diagnosis) revealed new nonsynonymous mutations compared with the time of lung explant or current treatment at t = 1. The mean number of SNPs in drug-resistance–associated genes (target site and efflux pumps) in the seven sets of isolates is for nonsynonymous mutations. Genes with new target site mutations included gyrA (quinolone resistance) and gidB (aminoglycoside resistance), consistent with evolution from multidrug-resistant tuberculosis before current treatment episode to extensively drug-resistant tuberculosis after ∼5 months of therapy.

References

    1. World Health Organization. United Nations high-level meeting on antimicrobial resistance. Geneva: World Health Organization, 2016 [accessed 2017 Nov 27]. Available from: http://www.un.org/pga/71/2016/09/21/press-release-hl-meeting-on-antimicr...
    1. Dheda K, Gumbo T, Maartens G, Dooley KE, McNerney R, Murray M, et al. The epidemiology, pathogenesis, transmission, diagnosis, and management of multidrug-resistant, extensively drug-resistant, and incurable tuberculosis. Lancet Respir Med. [online ahead of print] 15 Mar 2017; DOI: 10.1016/S2213-2600(17)30079-6. - PubMed
    1. Dheda K, Limberis JD, Pietersen E, Phelan J, Esmail A, Lesosky M, et al. Outcomes, infectiousness, and transmission dynamics of patients with extensively drug-resistant tuberculosis and home-discharged patients with programmatically incurable tuberculosis: a prospective cohort study. Lancet Respir Med. 2017;5:269–281. - PubMed
    1. Dheda K, Gumbo T, Gandhi NR, Murray M, Theron G, Udwadia Z, et al. Global control of tuberculosis: from extensively drug-resistant to untreatable tuberculosis. Lancet Respir Med. 2014;2:321–338. - PMC - PubMed
    1. Pietersen E, Ignatius E, Streicher EM, Mastrapa B, Padanilam X, Pooran A, et al. Long-term outcomes of patients with extensively drug-resistant tuberculosis in South Africa: a cohort study. Lancet. 2014;383:1230–1239. - PubMed

Publication types

Substances

LinkOut - more resources