. 2018 Sep;95(9):829-836.
doi: 10.1097/OPX.0000000000001229.

Visual Acuity Is Not the Best at the Preferred Retinal Locus in People with Macular Disease

Affiliations

Visual Acuity Is Not the Best at the Preferred Retinal Locus in People with Macular Disease

Jean-Baptiste Bernard et al. Optom Vis Sci. 2018 Sep.

Abstract

Significance: Little is known about how the preferred retinal locus (PRL) develops in patients with macular disease. We found that acuity is worse at the PRL than at other retinal locations around the scotoma, suggesting that the selection of the PRL location is unlikely to be based on optimizing acuity.

Purpose: Following the onset of bilateral macular disease, most patients adopt a retinal location outside the central scotoma, the PRL, as their new retinal location for visual tasks. Very little information is known about how the location of a PRL is chosen. In this study, we tested the hypothesis that the selection of the location for a PRL is based on optimizing visual acuity, which predicts that acuity is the best at the PRL, compared with other retinal locations.

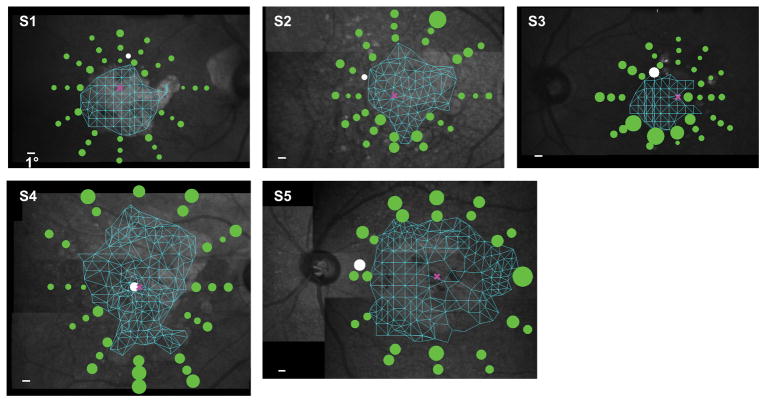
Methods: Using a scanning laser ophthalmoscope that allowed us to position visual targets at precise retinal locations, we measured acuity psychophysically using a four-orientation Tumbling-E presented at the PRL and at multiple (ranged between 23 and 36 across observers) locations around the scotoma for five observers with bilateral macular disease.

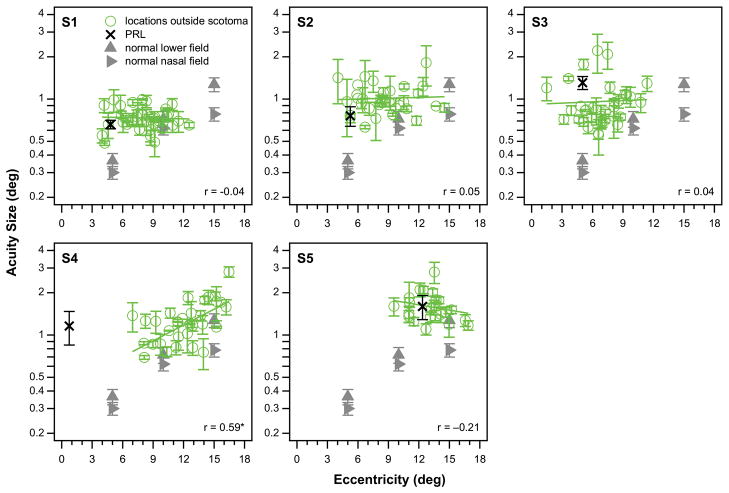
Results: For all five observers, the acuity at the PRL was never the best among all testing locations. Instead, acuities were better at 15 to 86% of the testing locations other than the PRL, with the best acuity being 17 to 58% better than that at the PRL. The locations with better acuities did not cluster around the PRL and did not necessarily lie at the same distance from the fovea or the PRL.

Conclusions: Our finding that acuity is worse at the PRL than at other locations around the scotoma implies that the selection of the PRL location is unlikely to be based on optimizing acuity.


Figures

Appendix Figure A1
Appendix Figure A1
Acuity thresholds are plotted (green circles) for each observer as a function of the distance of the testing locations from the edge of the scotoma, with the green solid line representing the best-fit regression line to the data-set. The correlation coefficient of the regression line is given in the bottom right corner in each panel. None of the correlation coefficients are significant. The black cross in each panel plots the acuity threshold at the preferred retinal locus. Error bars represent ± 1 standard error of the mean.
Figure 1
Figure 1
An example of how we determined the testing locations around the scotoma of an observer with macular disease. (A) Results of microperimetry from observer S1. Blue dots represent locations where she did not see the stimulus dot, and white dots represent locations where she saw the stimulus dot. (B) Based on the seeing/not-seeing data, we used the Delaunay triangulation to determine the scotoma map, represented by the mesh plot. (C) The location corresponding to the anatomical fovea (represented by the pink rectangle) was identified (see text for details) and 12 meridians (30 angular degrees apart) were added with the origins placed at the fovea, shown as white dashed lines. (D) Three locations (represented by the yellow dots) were identified along each meridian as the testing locations. For other observers, depending on availability of the observers and the specific shape of the scotoma, often two or three locations were tested along a meridian. The background fundus image of the observer was obtained from only a single frame of video.
Figure 2
Figure 2
Acuity thresholds are plotted as green circles around the scotoma of the five observers. For comparison, the acuity threshold at the preferred retinal locus is also plotted, as represented by the white circle. The size of each circle scales with the acuity threshold (the white calibration bar in each panel represents 1°). The mesh plot in cyan represents the results of the Delaunay triangulation that we used to determine the scotoma map. The pink cross in each panel represents the location of the fovea (based on standard measurements, see text for details). Note that observer S4 still had foveal sparing, resulting in a small island that she used to process small stimuli, thus her preferred retinal locus appeared to be very close to the fovea. The background fundus image of each observer was obtained from only a single frame of video.
Figure 3
Figure 3
Acuity thresholds are plotted (green circles) for each observer as a function of the eccentricity of the testing locations from the fovea, with the green solid line representing the best-fit regression line to the data-set. The correlation coefficient of the regression line is given in the bottom right corner in each panel. The black cross in each panel plots the acuity threshold at the preferred retinal locus eccentricity. For these measurements, the associated error bars represent ± 1 standard error of the mean. Data points without error bars mean that we only had one useable block of trials to determine the acuity threshold for that location. For comparison, acuity thresholds obtained at 5, 10 and 15° eccentricity from 11 older adults with normal vision are given as gray triangles (two visual fields were tested), with the error bars representing ±95% confidence intervals. Only observer S4 (with a small foveal island and a preferred retinal locus close to the fovea) showed a significant correlation between acuity and eccentricity of the testing locations, as denoted by an asterisk next to the correlation coefficient.
Figure 4
Figure 4
Acuity thresholds are plotted (green circles) for each observer as a function of the distance of the testing locations from the preferred retinal locus, with the green solid line representing the best-fit regression line to the data-set. The correlation coefficient of the regression line is given in the bottom right corner in each panel. The black cross in each panel plots the acuity threshold at the preferred retinal locus. As is the case for the relationship between acuity and eccentricity, only observer S4 showed a significant correlation between acuity and the distance of the testing locations from the preferred retinal locus, as denoted by an asterisk next to the correlation coefficient. Error bars represent ± 1 standard error of the mean.

Comment in

References

    1. Cummings RW, Whittaker SG, Watson GR, Budd JM. Scanning Characters and Reading with a Central Scotoma. Am J Optom Physiol Opt. 1985;62:833–43. - PubMed
    1. Timberlake GT, Mainster MA, Peli E, et al. Reading with a Macular Scotoma. I. Retinal Location of Scotoma and Fixation Area. Invest Ophthalmol Vis Sci. 1986;27:1137–47. - PubMed
    1. Lei H, Schuchard RA. Using Two Preferred Retinal Loci for Different Lighting Conditions in Patients with Central Scotomas. Invest Ophthalmol Vis Sci. 1997;38:1812–8. - PubMed
    1. Crossland MD, Crabb DP, Rubin GS. Task-Specific Fixation Behavior in Macular Disease. Invest Ophthalmol Vis Sci. 2011;52:411–6. - PubMed
    1. Duret F, Issenhuth M, Safran A. Combined Use of Several Preferred Retinal Loci in Patients with Macular Disorders when Reading Single Words. Vision Res. 1999;39:873–9. - PubMed

Publication types