. 2019 Jun 1;29(6):2509-2523.
doi: 10.1093/cercor/bhy121.

Emergent Functional Network Effects in Parkinson Disease

Affiliations

Emergent Functional Network Effects in Parkinson Disease

Caterina Gratton et al. Cereb Cortex. .

Erratum in

  • Emergent Functional Network Effects in Parkinson Disease.
    Gratton C, Koller JM, Shannon W, Greene DJ, Maiti B, Snyder AZ, Petersen SE, Perlmutter JS, Campbell MC. Gratton C, et al. Cereb Cortex. 2019 Apr 1;29(4):1701. doi: 10.1093/cercor/bhy229. Cereb Cortex. 2019. PMID: 30418543 Free PMC article. No abstract available.

Abstract

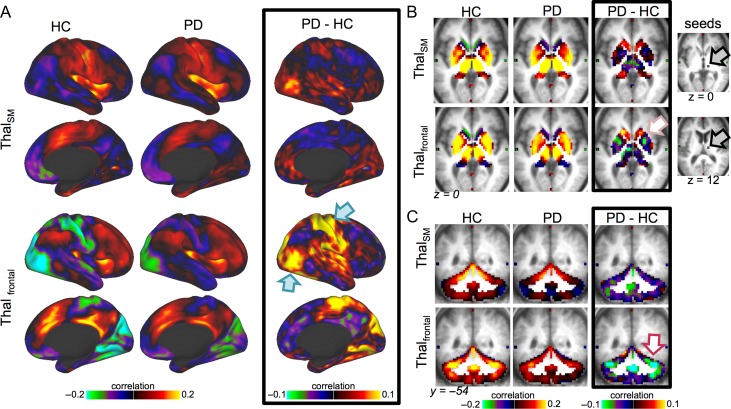
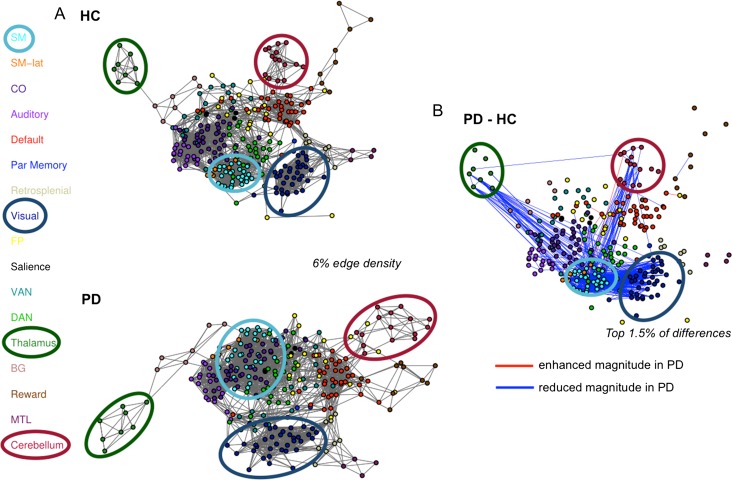
The hallmark pathology underlying Parkinson disease (PD) is progressive synucleinopathy, beginning in caudal brainstem that later spreads rostrally. However, the primarily subcortical pathology fails to account for the wide spectrum of clinical manifestations in PD. To reconcile these observations, resting-state functional connectivity (FC) can be used to examine dysfunction across distributed brain networks. We measured FC in a large, single-site study of nondemented PD (N = 107; OFF medications) and healthy controls (N = 46) incorporating rigorous quality control measures and comprehensive sampling of cortical, subcortical and cerebellar regions. We employed novel statistical approaches to determine group differences across the entire connectome, at the network-level, and for select brain regions. Group differences respected well-characterized network delineations producing a striking "block-wise" pattern of network-to-network effects. Surprisingly, these results demonstrate that the greatest FC differences involve sensorimotor, thalamic, and cerebellar networks, with notably smaller striatal effects. Split-half replication demonstrates the robustness of these results. Finally, block-wise FC correlations with behavior suggest that FC disruptions may contribute to clinical manifestations in PD. Overall, these results indicate a concerted breakdown of functional network interactions, remote from primary pathophysiology, and suggest that FC deficits in PD are related to emergent network-level phenomena rather than focal pathology.

Keywords: Parkinson disease; fMRI; functional connectivity; networks.


Figures

Figure 1.
Figure 1.
Networks and Regions. We examined resting-state correlations in a comprehensive set of cortical and subcortical regions representing 17 distinct networks. (A) Cortical networks, defined by cortical parcellation, included sensorimotor and association networks (Gordon et al. 2016). (B) Subcortical networks included striatal, medial temporal (MTL), thalamic, and cerebellar regions.
Figure 2.
Figure 2.
Large-scale networks in Parkinson disease and controls. (A) Large-scale networks in HC (left) and PD (right) participants, shown in the form of a correlation matrix. Both PD and HC participants showed strong network organization, with high correlations within each network (diagonal) and low correlations between networks (off-diagonals). (B) Direct comparison between groups shows prominent and highly structured differences characterized by a block-specific pattern. (C) Multidimensional scaling plot shows the relative positions of PD (blue) and HC (red) matrices in multidimensional space. Large diamonds represent the central tendency of each group (G*), determined using the Gibbs distribution. The dashed line marks the distance between the 2 G* matrices. (D) The difference between GPD* and GHC* matrices using OODA is depicted, with significance assessed by bootstrapping (P < 0.001).
Figure 3.
Figure 3.
Significant Block-Level Differences between PD and HC. (A) We permuted participant group labels to identify blocks with significant mean absolute differences between PD and HC groups (P < 0.05, FDR correcting for the number of blocks). Significant blocks are shown in hot colors, as the absolute difference in FC per block. See Table 2 for a ranking of blocks. (B) Here, we separately show the PD-HC differences of significant blocks, for connections that were positive in HC (left) and negative in HC (right). Most positive connections decrease and most negative connections increase in PD relative to HCs, indicating a reduction in FC magnitude (Supplementary Fig. S6).
Figure 4.
Figure 4.
Motor hand seed. We present correlation maps for a motor seed (region shown with a gray patch, indicated with gray arrow in A). (A) Motor cortex FC is projected onto an inflated cortical surface for HC (left), PD (middle), or the group difference (right). PD was associated with decreases in motor FC to sensorimotor and visual regions (cyan arrows) and increases to Salience/CO and FP regions (purple arrows). These differences represent weaker FC in PD relative to HC. Only the right hemisphere is shown, but FC differences were bilaterally symmetric. (B) The same comparisons are shown for volumetric views of subcortical regions. In PD relative to HC, motor cortex FC increased to the cerebellum, especially in motor subregions (indicating stronger FC, maroon arrows). In contrast, motor cortex FC showed little difference to motor subregions of the thalamus, but increased substantially in association-related thalamic subregions (purple arrows; Fig. 5). Motor cortex FC also weakly increased to the striatum, especially in nonmotor subregions of the caudate and anterior putamen (pink arrows; see Supplementary Fig. S7). As with cortical FC, thalamic and striatal FC differences were associated with weakened FC magnitude in PD. Motor cortex FC differences were consistent across sensorimotor regions.
Figure 5.
Figure 5.
Thalamic seeds. Thalamic FC is shown for 2 thalamic seeds: a seed centered on somatomotor subregions (top row) and a seed centered on frontal association subregions (bottom row; see seeds in gray to the right of B). Columns represent the HC, PD, and group difference FC maps, respectively. Cortical (A), striatum/thalamus (B), and cerebellum (C) differences are shown. The strongest thalamic differences were for frontal thalamic subregions, rather than motor thalamic subregions. This included increases between thalamic subregions and sensorimotor and visual cortex (cyan arrows), decreases to the cerebellum (maroon arrow), and mixed effects in the striatum, with increases to the caudate and decreases to anterior putamen (pink arrow).
Figure 6.
Figure 6.
Spring Embedded Graphs. (A) Graph depictions of networks in HC (top) and PD (bottom; shown for 6% edge density). Brain regions are shown as nodes (filled circles, colors indicate network identity), and edges between nodes indicate functional connections. (B) We highlight the strongest FC differences between PD and HC (red lines = increased FC magnitude for PD, blue lines = decreased FC magnitude for PD; shown for the top 1.5% of differences; nodes are positioned as in the top graph in A). Strong FC reductions appeared within and between sensorimotor, cerebellar, and thalamic networks. A few selective increases were present between SM and association networks (CO, FP, Salience) and the cerebellum.

Similar articles

Cited by

References

    1. Aarsland D, Kramberger MG. 2015. Neuropsychiatric symptoms in Parkinson’s disease. J Parkinsons Dis. 5:659–667. - PubMed
    1. Abbruzzese G, Berardelli A. 2003. Sensorimotor integration in movement disorders. Mov Disord. 18:231–240. - PubMed
    1. Alexander GE, Crutcher MD, DeLong MR. 1990. Basal ganglia-thalamocortical circuits: parallel substrates for motor, oculomotor, “prefrontal” and “limbic” functions. Prog Brain Res. 85:119–146. - PubMed
    1. Amboni M, Tessitore A, Esposito F, Santangelo G, Picillo M, Vitale C, Giordano A, Erro R, de Micco R, Corbo D, et al. . 2015. Resting-state functional connectivity associated with mild cognitive impairment in Parkinson’s disease. J Neurol. 262:425–434. - PubMed
    1. Astafiev SV, Snyder AZ, Shulman GL, Corbetta M. 2010. Comment on “Modafinil shifts human locus coeruleus to low-tonic, high-phasic activity during functional MRI” and “Homeostatic sleep pressure and responses to sustained attention in the suprachiasmatic area”. Science. 328:309; author reply 309. - PMC - PubMed

Publication types