. 2018 Jun 7;16(6):e2004880.
doi: 10.1371/journal.pbio.2004880. eCollection 2018 Jun.

METTL3-mediated m6A modification is required for cerebellar development

Affiliations

METTL3-mediated m6A modification is required for cerebellar development

Chen-Xin Wang et al. PLoS Biol. .

Abstract

N6-methyladenosine (m6A) RNA methylation is the most abundant modification on mRNAs and plays important roles in various biological processes. The formation of m6A is catalyzed by a methyltransferase complex including methyltransferase-like 3 (METTL3) as a key factor. However, the in vivo functions of METTL3 and m6A modification in mammalian development remain unclear. Here, we show that specific inactivation of Mettl3 in mouse nervous system causes severe developmental defects in the brain. Mettl3 conditional knockout (cKO) mice manifest cerebellar hypoplasia caused by drastically enhanced apoptosis of newborn cerebellar granule cells (CGCs) in the external granular layer (EGL). METTL3 depletion-induced loss of m6A modification causes extended RNA half-lives and aberrant splicing events, consequently leading to dysregulation of transcriptome-wide gene expression and premature CGC death. Our findings reveal a critical role of METTL3-mediated m6A in regulating the development of mammalian cerebellum.


Conflict of interest statement

The authors have declared that no competing interests exist.

Figures
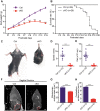
Fig 1
Fig 1. Characterization of the Mettl3 conditional knockout mice.
(A) Body weight changes of the Ctrl and cKO mice during the first 2 wk after birth. (B) Kaplan–Meier survival curves showing the survival rates of both Ctrl and cKO mice. (C) Tail suspension test of both Ctrl and cKO mice. (D, E) Open field test of Ctrl and cKO mice for their speed (D) and total traveled distance (E). (F) MRI of mice sagittal brain section. Scale bar, 1 mm. (G, H) Surface areas of the whole brain (G) and cerebellum (H) of Ctrl and cKO mice. Sagittal section. The data underlying this figure can be found in S1 Data. Data shown are means ± SEM, n = 4. **p-value < 0.01, ***p-value < 0.001, Student t test. cKO, Mettl3 conditional knockout; Ctrl, control; Mettl3, methyltransferase-like 3; MRI, magnetic resonance imaging; SEM, standard error of the mean.
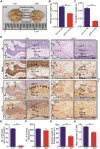
Fig 2
Fig 2. Mettl3 conditional knockout causes cerebellar hypoplasia in mice.
(A) Macromorphological comparison between brains of the Ctrl and cKO mice. (B, C) Weight of the whole brain (B) and cerebellum (C) of the Ctrl and cKO mice. (D) Histological abnormalities of cerebellum in cKO mice shown by HE staining, NeuN, D-28K, and GFAP immunohistochemical staining. Scale bar, 200 μm. (E, F) Density difference of granule cells (E) and Purkinje cells (F) in the Ctrl and cKO mouse cerebellums. (G, H) Dendrite length (G) and mean calbindin D-28K staining intensity. (H) Difference of Purkinje cells in the Ctrl and cKO cerebellums. P14 mice were used in all studies. Data related to this figure are shown in S1 Data. Data shown are means ± SEM. For cell number count in (E) and (F), n = 3; for dendrite length and D-28K staining intensity in (G) and (H), n = 10. ***p-value < 0.001, Student t test. cKO, Mettl3 conditional knockout; Ctrl, control; D-28K, calbindin 1; EGL, external granular layer; GFAP, glial fibrillary acid protein; HE, hematoxylin and eosin; IGL, internal granular layer; Mettl3, methyltransferase-like 3; ML, molecular layer; NeuN, neuronal nuclei; PCL, Purkinje cell layer; SEM, standard error of the mean.
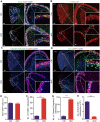
Fig 3
Fig 3. Mettl3 conditional knockout induces apoptosis of newborn granule cells.
(A) BrdU (green), Ki67 (red), and DAPI (blue) immunofluorescent staining of Ctrl and cKO mouse cerebellums 2 h after BrdU injection. (B) TUNEL (green) and PI (red) staining of P7 Ctrl and cKO mouse cerebellums. (C) Cleaved Caspase-3 (green), Ki67 (red), and DAPI (blue) immunofluorescent staining of P7 Ctrl and cKO mouse cerebellums. (D) BrdU (green), Ki67 (red), and DAPI (blue) immunofluorescent staining of Ctrl and cKO mouse cerebellums 48 h after BrdU injection. (E) Proportion of Ki67+/DAPI+ cells in the EGL of P7 Ctrl and cKO mice. (F, G) Density of TUNEL+ (F) and Cleaved Caspase-3+ (G) cells in P7 Ctrl and cKO mouse cerebellums. (H) Density of BrdU+/Ki67 cells in the EGL of Ctrl and cKO mice 48 h post–BrdU injection. Scale bars in (A–D), 200 μm for left panels; 25 μm for right panels. Data related to this figure are shown in S1 Data. Data shown are means ± SEM. Three sections of each sample were analyzed. ***p-value < 0.001, Student t test. BrdU, bromodeoxyuridine; cKO, Mettl3 conditional knockout; Ctrl, control; EGL, external granular layer; Ki67, antigen identified by monoclonal antibody Ki 67; Mettl3, methyltransferase-like 3; PI, Propidium iodide; SEM, standard error of the mean.
Fig 4
Fig 4. m6A depletion induces dramatic gene expression changes in the cerebellum.
(A) The most enriched sequence motif of m6A peaks in mRNAs from P7 mouse cerebellums. (B) Distribution of m6A peaks along the 5′UTR, CDS, and 3′UTR regions of total cerebellar mRNAs from P7 Ctrl mice after normalized with length. (C) Venn diagram representing the relationships between cerebellar expressed genes and m6A modification. Green circle represents all expressed genes in P7 Ctrl mouse cerebellums, brown circle represents genes with m6A modifications in P7 Ctrl mouse cerebellums, red circle represents genes with up-regulated expression in P7 Mettl3 cKO mouse cerebellums as compared to the Ctrl, and blue circle represents genes with down-regulated expression in P7 Mettl3 cKO mouse cerebellums as compared to the Ctrl. Numbers represent the counts of genes in each group. (D) Significantly enriched (p-value ≤ 0.01, Benjamini–Hochberg multiple testing correction) GO terms of genes with up-regulated expression in P7 cKO cerebellums and with m6A peaks. CDS, coding sequence; cKO, Mettl3 conditional knockout; GO, gene ontology; JAK-STAT, Janus kinase (JAK), Signal Transducer and Activator of Transcription protein (STAT); m6A, N6-methyladenosine.
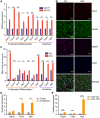
Fig 5
Fig 5. m6A depletion enhances the stability of development- and apoptosis-associated gene transcripts.
(A) qRT-PCR results confirmed the up-regulated expression in P7 cKO cerebellums of selected genes. The major functions of detected genes are shown under the lines. (B) Immunostaining for Sox2 (red), Nestin (green), and Mettl3 (purple) in neural stem cell lines established from Ctrl and Mettl3 cKO neonatal mice. Scale bar, 100 μm. (C) The RNA half-lives of genes detected in (A). Values and error bars in (A) and (C) represent the mean and SEM of three independent experiments. (D) qRT-PCR results confirmed higher expression levels of apoptosis-promoting genes (Dapk1, Fadd, Ngfr) in cerebellums of P7 wild-type mice than those in the cortex. (E) qRT-PCR results confirmed the up-regulated expression of the apoptosis-promoting genes in the cKO CGCs. Data related to this figure are shown in S1 Data. Data shown are means ± SEM. *p-value < 0.05, **p-value < 0.01, ***p-value < 0.001, ****p-value < 0.0001, Student t test. CGC, cerebellar granule cell; cKO, Mettl3 conditional knockout; Ctrl, control; Mettl3, methyltransferase-like 3; qRT-PCR, quantitative reverse transcription-polymerase chain reaction; RT-PCR, reverse transcription-polymerase chain reaction; SEM, standard error of the mean.
Fig 6
Fig 6. m6A depletion induces exon exclusion in synapse-associated genes.
(A) Genes producing exon-excluded transcripts in P7 cKO cerebellums as compared with the Ctrl. (B) Enriched pathways of genes producing exon-excluded transcripts in P7 cKO cerebellums as compared with the Ctrl. Enriched pathways under the “Neuronal system” are expanded on the right. (C) Production of exon-excluded transcripts of major synapse-associated genes in P7 cKO cerebellums. Left, IGV tracks displaying the RNA-seq reads coverage in P7 Ctrl (blue) and cKO (red) cerebellum, the excluded exons are shaded with pink columns. Middle, calculated exon-exclusion percentage in P7 cKO cerebellums by the PSI value. Right, semiquantitative PCR detection of exon-excluded transcripts in P7 cKO cerebellums. (D) Images of the CGCs in the calcium detection assay. Grin1001 or Grin1011 was introduced into the cKO CGCs by electroporation and was co-expressed with mCherry (red). Fluo-4 (rainbow) indicated the cellular calcium concentration in the CGCs. Scale bar, 5 μm. (E) Statistical analysis of the cellular calcium concentration in the calcium detection assay. (F) CCK8 assay shows the survival rate of the Ctrl CGCs with overexpression of mCherry and cKO CGCs with overexpression of Grin1001 or Grin1011 in 3 DIV and 5 DIV. (G) Schematic diagram illustrating the mechanisms underlying the regulatory functions of METTL3-mediated m6A modification in cerebellar development. Red dots represent m6A modification. The box and line symbols in the right part of the diagram represent pre-spliced RNAs, with exons shown as boxes and introns shown as black lines. Exons in post-spliced RNAs are connected by red lines. Further information about this figure can be found in S1 Data. The data were represented as means ± SEM. For calcium concentration detection, n = 10; for CCK8 assay, n = 3. *p-value < 0.05, **p-value < 0.01, ***p-value < 0.001, Student t test. AMPA, α-amino-3-hydroxy-5-methyl-4-isoxazolepropionic acid; BF, bright field; CCK8, Cell Counting Kit-8; CGC, cerebellar granule cell; cKO, Mettl3 conditional knockout; CREB, cAMP responsive element binding protein; Ctrl, control; DIV, days in vitro; Grin1001, C1 region excluded variant of Grin1; Grin1011, C1 region included variant of Grin1; IGV, integrative genomics viewer; METTL3, methyltransferase-like 3; m6A, N6-methyladenosine; NMDA, N-methyl-D-aspartic acid; PKMT, Lysine methyltransferase; PPAR, peroxisome proliferator-activated receptor; PSI, percent spliced in index; RNA-seq, RNA sequencing; SEM, standard error of the mean.

References

    1. Yao B, Christian KM, He C, Jin P, Ming GL, Song H. Epigenetic mechanisms in neurogenesis. Nat Rev Neurosci. 2016;7: 537–549. - PMC - PubMed
    1. Hsieh J, Zhao X. Genetics and Epigenetics in Adult Neurogenesis. Cold Spring Harb Perspect Biol. 2016;8: a018911 doi: 10.1101/cshperspect.a018911 - DOI - PMC - PubMed
    1. Hwang JY, Aromolaran KA, Zukin RS. The emerging field of epigenetics in neurodegeneration and neuroprotection. Nat Rev Neurosci. 2017;18: 347–361. doi: 10.1038/nrn.2017.46 - DOI - PMC - PubMed
    1. Cholewa-Waclaw J, Bird A, von Schimmelmann M, Schaefer A, Yu H, Song H, et al. The Role of Epigenetic Mechanisms in the Regulation of Gene Expression in the Nervous System. J Neurosci. 2016;36: 11427–11434. doi: 10.1523/JNEUROSCI.2492-16.2016 - DOI - PMC - PubMed
    1. Ma DK, Marchetto MC, Guo JU, Ming GL, Gage FH, Song H. Epigenetic choreographers of neurogenesis in the adult mammalian brain. Nat Neurosci. 2010;13: 1338–1344. doi: 10.1038/nn.2672 - DOI - PMC - PubMed

Publication types

MeSH terms

Supplementary concepts