

Glutathione metabolism in type 2 diabetes and its relationship with microvascular complications and glycemia
- PMID: 29879181
- PMCID: PMC5991679
- DOI: 10.1371/journal.pone.0198626
Glutathione metabolism in type 2 diabetes and its relationship with microvascular complications and glycemia
Abstract
Aims/hypotheses: We hypothesized that there is decreased synthesis of glutathione (GSH) in type 2 diabetes (T2DM) especially in the presence of microvascular complications, and this is dependent on the degree of hyperglycemia.
Methods: In this case-control study, we recruited 16 patients with T2DM (7 without and 9 with microvascular complications), and 8 age- and sex-matched non-diabetic controls. We measured GSH synthesis rate using an infusion of [2H2]-glycine as isotopic tracer and collection of blood samples for liquid chromatography mass spectrometric analysis.
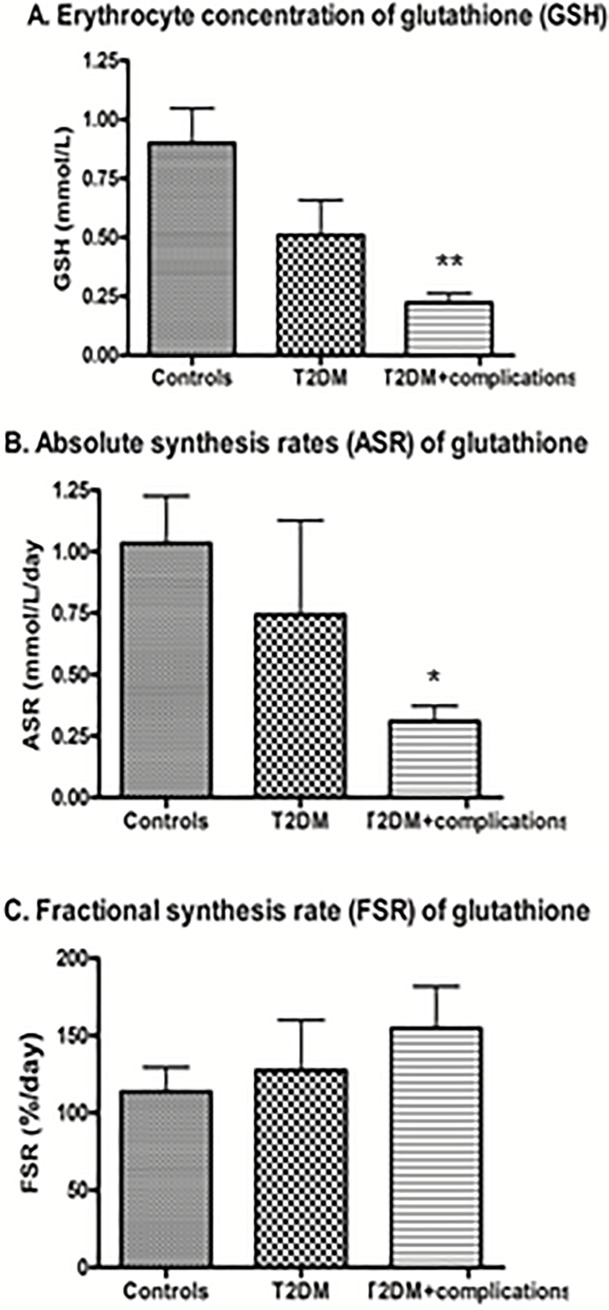
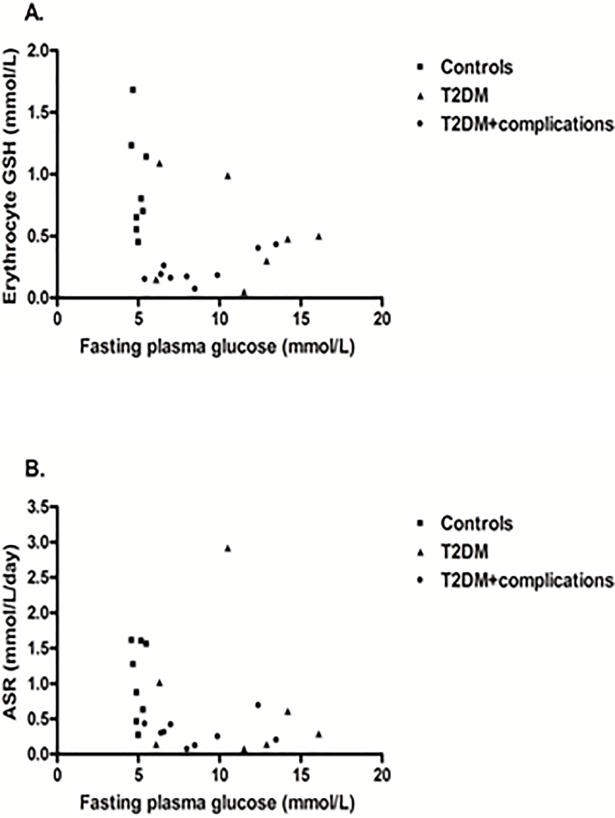
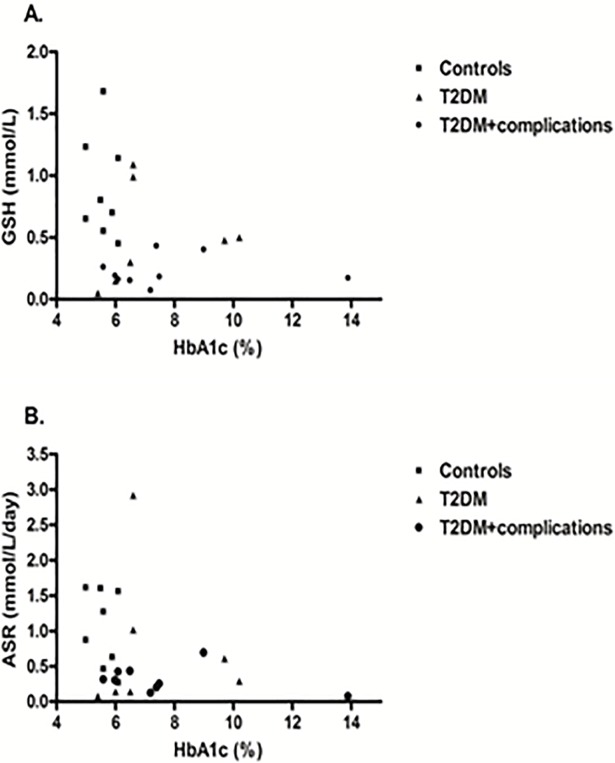
Results: Compared to the controls, T2DM patients had lower erythrocyte GSH concentrations (0.90 ± 0.42 vs. 0.35 ± 0.30 mmol/L; P = 0.001) and absolute synthesis rates (1.03 ± 0.55 vs. 0.50 ± 0.69 mmol/L/day; P = 0.01), but not fractional synthesis rates (114 ± 45 vs. 143 ± 82%/day; P = 0.07). The magnitudes of changes in patients with complications were greater for both GSH concentrations and absolute synthesis rates (P-values ≤ 0.01) compared to controls. There were no differences in GSH concentrations and synthesis rates between T2DM patients with and without complications (P-values > 0.1). Fasting glucose and HbA1c did not correlate with GSH concentration or synthesis rates (P-values > 0.17).
Conclusions: Compared to non-diabetic controls, patients with T2DM have glutathione deficiency, especially if they have microvascular complications. This is probably due to reduced synthesis and increased irreversible utilization by non-glycemic mechanisms.
Conflict of interest statement
The authors have declared that no competing interests exist.
Figures
References
-
- NCD Risk Factor Collaboration (NCD-RisC). Worldwide trends in diabetes since 1980: a pooled analysis of 751 population-based studies with 4.4 million participants. Lancet. 2016;387(10027):1513–30. doi: 10.1016/S0140-6736(16)00618-8 - DOI - PMC - PubMed
-
- Boyne MS. Diabetes in the Caribbean: Trouble in Paradise. Insulin 2009;4(2):94–105.
-
- Ferguson TS, Tulloch-Reid MK, Wilks RJ. The epidemiology of diabetes mellitus in Jamaica and the Caribbean: a historical review. West Indian Med J. 2010;59(3):259–64. - PubMed
-
- UK Prospective Diabetes Study (UKPDS) Group. Intensive blood-glucose control with sulphonylureas or insulin compared with conventional treatment and risk of complications in patients with type 2 diabetes (UKPDS 33). Lancet. 1998;352(9131):837–53. - PubMed
-
- Brownlee M. Biochemistry and molecular cell biology of diabetic complications. Nature. 2001;414(6865):813–20. doi: 10.1038/414813a - DOI - PubMed
Publication types
MeSH terms
Substances
LinkOut - more resources
Full Text Sources
Other Literature Sources
Medical
