Metabolic survey of Botryococcus braunii: Impact of the physiological state on product formation
- PMID: 29879215
- PMCID: PMC5991718
- DOI: 10.1371/journal.pone.0198976
Metabolic survey of Botryococcus braunii: Impact of the physiological state on product formation
Abstract
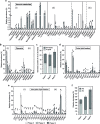
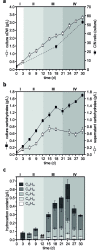
The microalga Botryococcus braunii is widely regarded as a potential renewable and sustainable source for industrial applications because of its capability to produce large amounts of metabolically expensive (exo-) polysaccharides and lipids, notably hydrocarbons. A comprehensive and systematic metabolic characterization of the Botryococcus braunii race A strain CCAP 807/2 was conducted within the present study, including the detailed analysis of growth-associated and physiological parameters. In addition, the intracellular metabolome was profiled for the first time and showed growth- and product-specific fluctuations in response to the different availability of medium resources during the cultivation course. Among the identified metabolites, a constant expression of raffinose was observed for the first time under standard conditions, which has until now only been described for higher plants. Overall, the multilayered analysis during the cultivation of strain CCAP 807/2 allowed the differentiation of four distinct physiological growth phases and revealed differences in the production profiles and content of liquid hydrocarbons and carbohydrates with up to 84% of organic dry weight (oDW). In the process, an enhanced production of carbohydrates with up to 63% of oDW (1.36±0.03 g L-1) could be observed during the late linear growth phase, whereas the highest accumulation of extracellular hydrocarbons with up to 24% of oDW (0.66±0.12 g L-1) occurred mainly during the stationary growth phase. Altogether, the knowledge obtained is potentially useful for the general understanding of the overall physiology of Botryococcus braunii and provide important insights into the growth behavior and product formation of this microalga, and is thus relevant for large scale biofuel production and industrial applications.
Conflict of interest statement
The authors have declared that no competing interests exist.
Figures


Similar articles
-
Characterization of the biofuel potential of a newly isolated strain of the microalga Botryococcus braunii Kützing from Assam, India.Bioresour Technol. 2013 Dec;149:268-75. doi: 10.1016/j.biortech.2013.09.057. Epub 2013 Sep 20. Bioresour Technol. 2013. PMID: 24121368
-
Low-cost production of green microalga Botryococcus braunii biomass with high lipid content through mixotrophic and photoautotrophic cultivation.Appl Biochem Biotechnol. 2014 Sep;174(1):116-29. doi: 10.1007/s12010-014-1041-9. Epub 2014 Jul 3. Appl Biochem Biotechnol. 2014. PMID: 24989454
-
Biomass and hydrocarbon production from Botryococcus braunii: A review focusing on cultivation methods.Sci Total Environ. 2024 May 20;926:171734. doi: 10.1016/j.scitotenv.2024.171734. Epub 2024 Mar 18. Sci Total Environ. 2024. PMID: 38508258 Review.
-
Bio-harvesting and pyrolysis of the microalgae Botryococcus braunii.Bioresour Technol. 2015 Sep;191:117-23. doi: 10.1016/j.biortech.2015.04.113. Epub 2015 May 6. Bioresour Technol. 2015. PMID: 25983230
-
High-value chemicals from Botryococcus braunii and their current applications - A review.Bioresour Technol. 2019 Nov;291:121911. doi: 10.1016/j.biortech.2019.121911. Epub 2019 Jul 27. Bioresour Technol. 2019. PMID: 31383389 Review.
Cited by
-
A bioprocess engineering approach for the production of hydrocarbons and fatty acids from green microalga under high cobalt concentration as the feedstock of high-grade biofuels.Biotechnol Biofuels Bioprod. 2024 May 10;17(1):64. doi: 10.1186/s13068-024-02512-6. Biotechnol Biofuels Bioprod. 2024. PMID: 38730294 Free PMC article.
-
Microalgae biofuels: illuminating the path to a sustainable future amidst challenges and opportunities.Biotechnol Biofuels Bioprod. 2024 Jan 23;17(1):10. doi: 10.1186/s13068-024-02461-0. Biotechnol Biofuels Bioprod. 2024. PMID: 38254224 Free PMC article. Review.
-
Phytoplankton consortia as a blueprint for mutually beneficial eukaryote-bacteria ecosystems based on the biocoenosis of Botryococcus consortia.Sci Rep. 2021 Jan 18;11(1):1726. doi: 10.1038/s41598-021-81082-1. Sci Rep. 2021. PMID: 33462312 Free PMC article.
-
Bioengineering of Microalgae: Recent Advances, Perspectives, and Regulatory Challenges for Industrial Application.Front Bioeng Biotechnol. 2020 Sep 3;8:914. doi: 10.3389/fbioe.2020.00914. eCollection 2020. Front Bioeng Biotechnol. 2020. PMID: 33014997 Free PMC article. Review.
-
Metabolomics and lipid profile analysis of Coccomyxa melkonianii SCCA 048.Extremophiles. 2021 Jul;25(4):357-368. doi: 10.1007/s00792-021-01234-z. Epub 2021 May 31. Extremophiles. 2021. PMID: 34057605 Free PMC article.
References
-
- Georgianna DR, Mayfield SP. Exploiting diversity and synthetic biology for the production of algal biofuels. Nature. 2012;488: 329–335. doi: 10.1038/nature11479 - DOI - PubMed
-
- Brodie J, Chan CX, De Clerck O, Cock JM, Coelho SM, Gachon C, et al. The Algal Revolution. Trends in Plant Science. 2017. pp. 726–738. doi: 10.1016/j.tplants.2017.05.005 - DOI - PubMed
-
- Banerjee A, Sharma R, Chisti Y, Banerjee UC. Botryococcus braunii: A renewable source of hydrocarbons and other chemicals. Crit Rev Biotechnol. 2002;22: 245–279. doi: 10.1080/07388550290789513 - DOI - PubMed
-
- Metzger P, Largeau C. Chemicals of Botryococcus braunii. Chemicals from microalgae In Cohen Z. (Ed.), Chemicals from Microalgae Taylor and Francis Ltd, London,.; 1999.
-
- Metzger P, Largeau C. Botryococcus braunii: A rich source for hydrocarbons and related ether lipids. Appl Microbiol Biotechnol. 2005;66: 486–496. doi: 10.1007/s00253-004-1779-z - DOI - PubMed
Publication types
MeSH terms
Substances
LinkOut - more resources
Full Text Sources
Other Literature Sources

