

Prediction of Shigellosis outcomes in Israel using machine learning classifiers
- PMID: 29880081
- PMCID: PMC9133678
- DOI: 10.1017/S0950268818001498
Prediction of Shigellosis outcomes in Israel using machine learning classifiers
Abstract
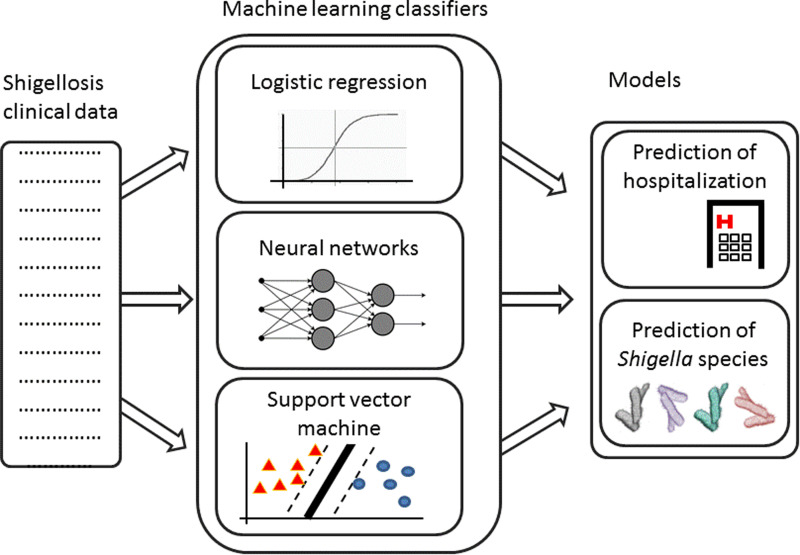
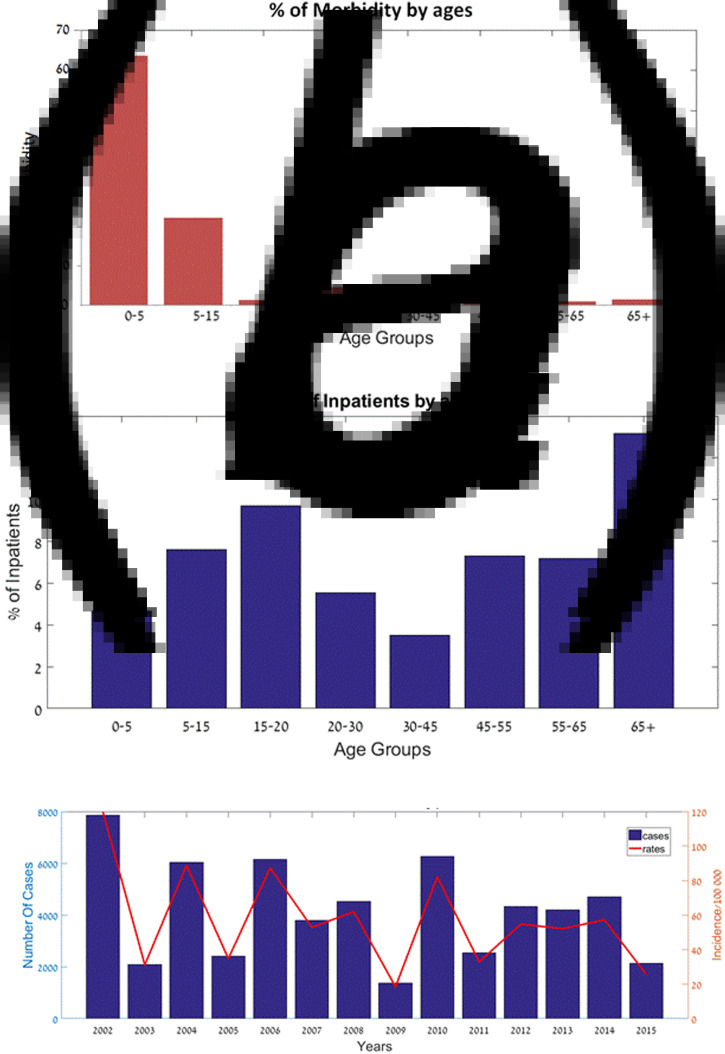
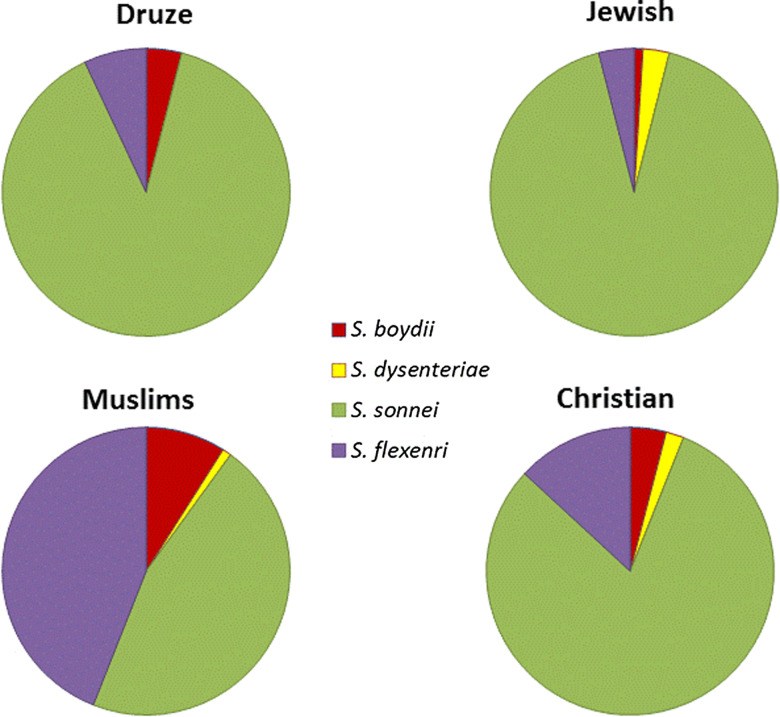
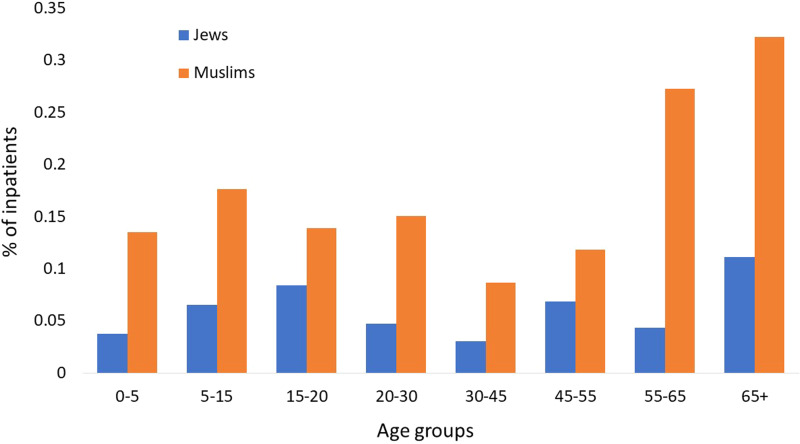
Shigellosis causes significant morbidity and mortality in developing and developed countries, mostly among infants and young children. The World Health Organization estimates that more than one million people die from Shigellosis every year. In order to evaluate trends in Shigellosis in Israel in the years 2002-2015, we analysed national notifiable disease reporting data. Shigella sonnei was the most commonly identified Shigella species in Israel. Hospitalisation rates due to Shigella flexenri were higher in comparison with other Shigella species. Shigella morbidity was higher among infants and young children (age 0-5 years old). Incidence of Shigella species differed among various ethnic groups, with significantly high rates of S. flexenri among Muslims, in comparison with Jews, Druze and Christians. In order to improve the current Shigellosis clinical diagnosis, we developed machine learning algorithms to predict the Shigella species and whether a patient will be hospitalised or not, based on available demographic and clinical data. The algorithms' performances yielded an accuracy of 93.2% (Shigella species) and 94.9% (hospitalisation) and may consequently improve the diagnosis and treatment of the disease.
Keywords: Epidemiology; Shigella; health statistics.
Conflict of interest statement
None.
Figures
Similar articles
-
Global burden of Shigella infections: implications for vaccine development and implementation of control strategies.Bull World Health Organ. 1999;77(8):651-66. Bull World Health Organ. 1999. PMID: 10516787 Free PMC article.
-
Four decades of shigellosis in Israel: epidemiology of a growing public health problem.Rev Infect Dis. 1991 Mar-Apr;13(2):248-53. doi: 10.1093/clinids/13.2.248. Rev Infect Dis. 1991. PMID: 2041956
-
Epidemiological, clinical and microbiological features of shigellosis among hospitalized children in northern Israel.Scand J Infect Dis. 1995;27(2):139-44. doi: 10.3109/00365549509018994. Scand J Infect Dis. 1995. PMID: 7660077
-
[Shigellosis abroad].Tr Inst Im Pastera. 1983;61:123-32. Tr Inst Im Pastera. 1983. PMID: 6379992 Review. Russian. No abstract available.
-
Neonatal shigellosis.Isr Med Assoc J. 2001 Dec;3(12):964-6. Isr Med Assoc J. 2001. PMID: 11794928 Review. No abstract available.
Cited by
-
Advances in machine learning-based bacteria analysis for forensic identification: identity, ethnicity, and site of occurrence.Front Microbiol. 2023 Dec 21;14:1332857. doi: 10.3389/fmicb.2023.1332857. eCollection 2023. Front Microbiol. 2023. PMID: 38179452 Free PMC article. Review.
-
Machine learning vs. classic statistics for the prediction of IVF outcomes.J Assist Reprod Genet. 2020 Oct;37(10):2405-2412. doi: 10.1007/s10815-020-01908-1. Epub 2020 Aug 11. J Assist Reprod Genet. 2020. PMID: 32783138 Free PMC article.
-
Twenty-five years of sentinel laboratory-based surveillance of shigellosis in a high-income country endemic for the disease, Israel, 1998 to 2022.Euro Surveill. 2024 Aug;29(31):2400022. doi: 10.2807/1560-7917.ES.2024.29.31.2400022. Euro Surveill. 2024. PMID: 39092530 Free PMC article.
-
Azithromycin non-susceptible Shigella circulating in Israel, 2014-2016.PLoS One. 2019 Oct 18;14(10):e0221458. doi: 10.1371/journal.pone.0221458. eCollection 2019. PLoS One. 2019. PMID: 31626667 Free PMC article.
-
Using Deep Learning in a Monocentric Study to Characterize Maternal Immune Environment for Predicting Pregnancy Outcomes in the Recurrent Reproductive Failure Patients.Front Immunol. 2021 Apr 1;12:642167. doi: 10.3389/fimmu.2021.642167. eCollection 2021. Front Immunol. 2021. PMID: 33868275 Free PMC article.
References
-
- CDC. Shigella – Shigellosis. Available at https://www.cdc.gov/shigella/index.html (Accessed 14 February 2018).
-
- Ansaruzzaman M et al. (2001) Epidemiology of postshigellosis persistent diarrhea in young children. Pediatric Infectious Disease Journal 20, 525–530. - PubMed
-
- World Health Organization. Guidelines for the control of shigellosis, including epidemics due to Shigella. Available at http://apps.who.int/iris/bitstream/10665/43252/1/924159330X.pdf (Accessed 14 February 2018).
MeSH terms
LinkOut - more resources
Full Text Sources
Other Literature Sources
