. 2018 Jun;11(6):e006131.
doi: 10.1161/CIRCEP.117.006131.

Role of 3-Dimensional Architecture of Scar and Surviving Tissue in Ventricular Tachycardia: Insights From High-Resolution Ex Vivo Porcine Models

Affiliations

Role of 3-Dimensional Architecture of Scar and Surviving Tissue in Ventricular Tachycardia: Insights From High-Resolution Ex Vivo Porcine Models

Farhad Pashakhanloo et al. Circ Arrhythm Electrophysiol. 2018 Jun.

Abstract

Background: An improved knowledge of the spatial organization of infarct structure and its contribution to ventricular tachycardia (VT) is important for designing optimal treatments. This study explores the relationship between the 3-dimensional structure of the healed infarct and the VT reentrant pathways in high-resolution models of infarcted porcine hearts.

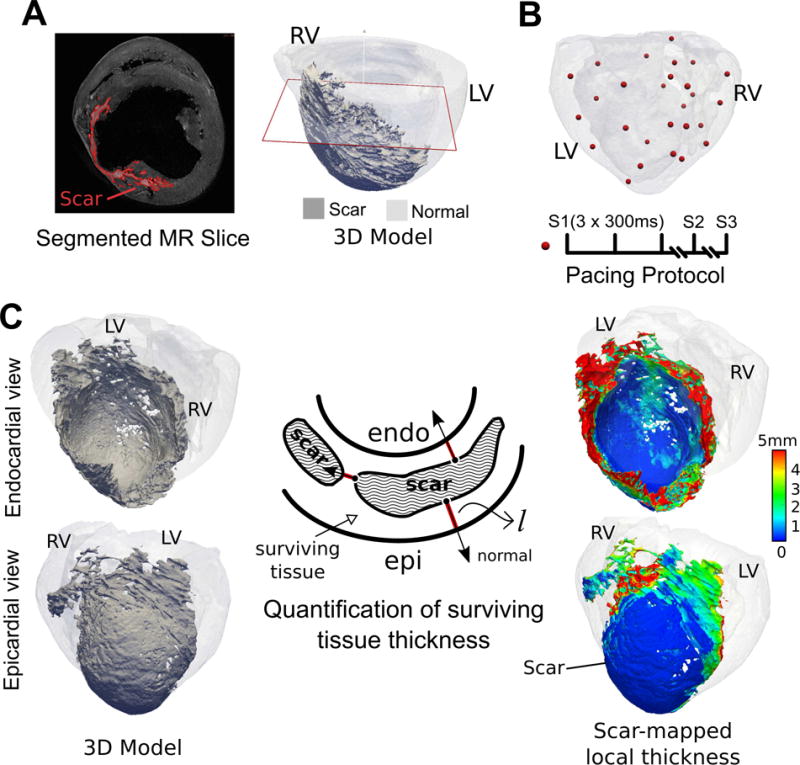
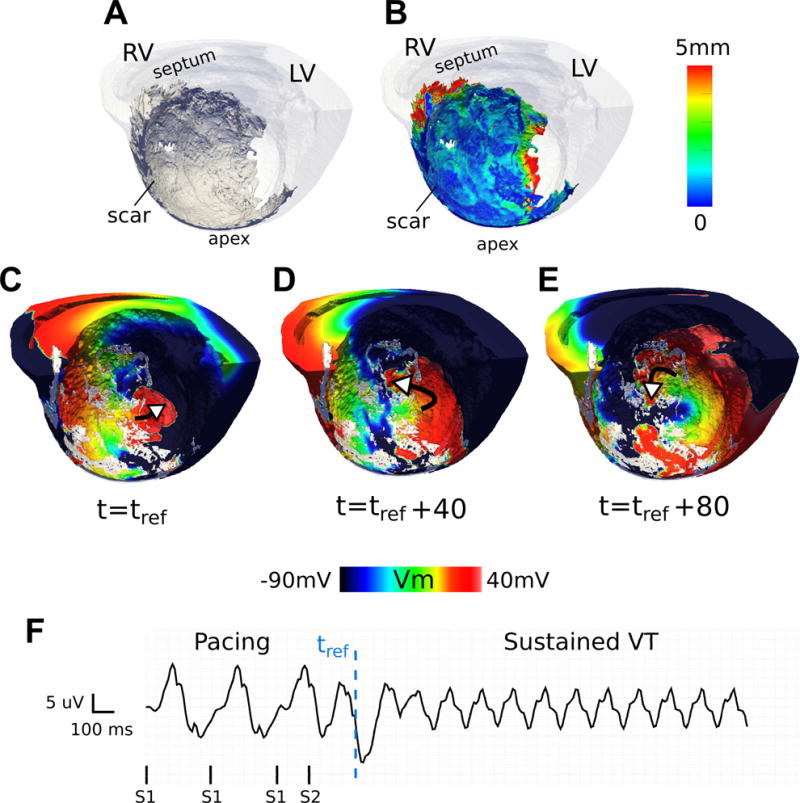
Methods: Structurally detailed models of infarcted ventricles were reconstructed from ex vivo late gadolinium enhancement and diffusion tensor magnetic resonance imaging data of 8 chronically infarcted porcine hearts at submillimeter resolution (0.25×0.25×0.5 mm3). To characterize the 3-dimensional structure of surviving tissue in the zone of infarct, a novel scar-mapped thickness metric was introduced. Further, using the ventricular models, electrophysiological simulations were conducted to determine and analyze the 3-dimensional VT pathways that were established in each of the complex infarct morphologies.

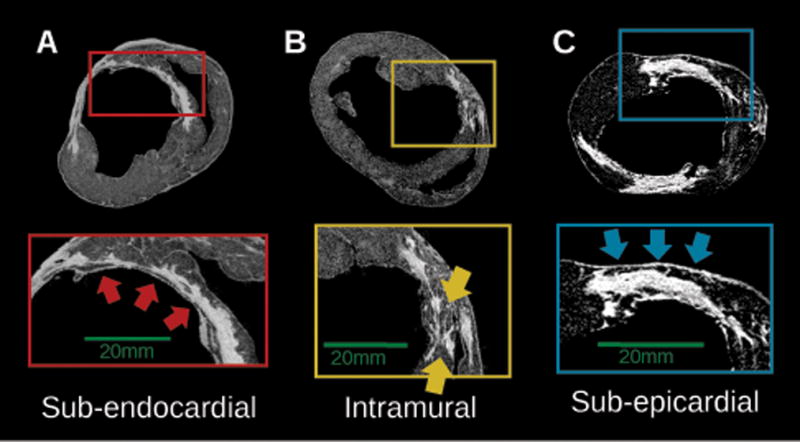
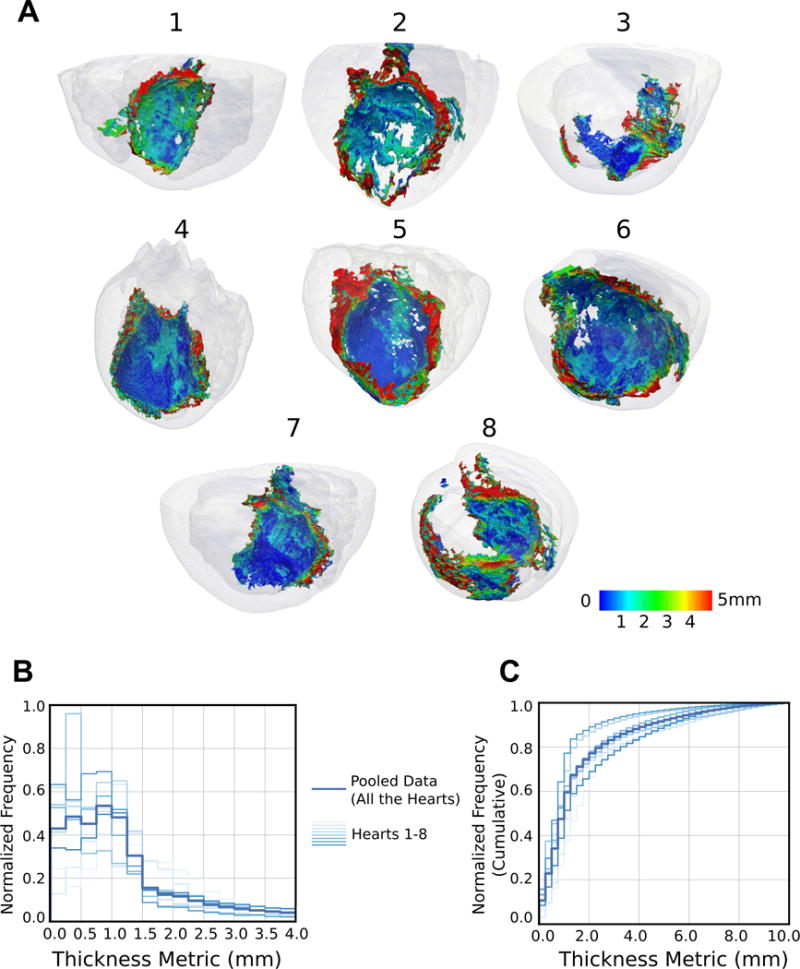
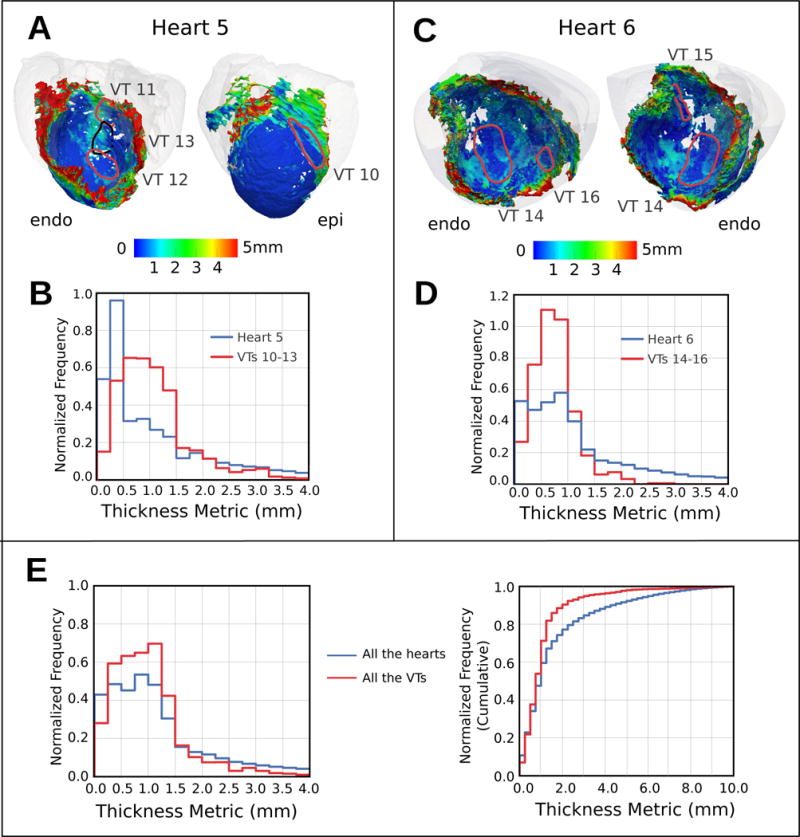
Results: The scar-mapped thickness metric revealed the heterogeneous organization of infarct and enabled us to systematically characterize the distribution of surviving tissue thickness in 8 hearts. Simulation results demonstrated the involvement of a subendocardial tissue layer of varying thickness in the majority of VT pathways. Importantly, they revealed that VT pathways are most frequently established within thin surviving tissue structures of thickness ≤2.2 mm (90th percentile) surrounding the scar.

Conclusions: The combination of high-resolution imaging data and ventricular simulations revealed the 3-dimensional distribution of surviving tissue surrounding the scar and demonstrated its involvement in VT pathways. The new knowledge obtained in this study contributes toward a better understanding of infarct-related VT.

Keywords: arrhythmias, cardiac; computer simulation; magnetic resonance imaging; myocardial infarction; tachycardia, ventricular.


Figures

Figure 1
Figure 1
Workflow of the study including imaging, model construction, VT simulation protocol, and the calculation of scar-mapped local thickness (SMLT) metric. (A) Left: A short-axis slice of LGE-MRI acquired at the voxel size of 0.25 × 0.25 × 0.5 mm3. The segmented scar is highlighted in red. Right: 3D reconstructed model of the same heart with the scar highlighted in dark gray and myocardium in transparent gray. The red plane shows the location of the short-axis MRI slice that is displayed in the left panel. (B) Pacing protocol. Top: 3D distribution of pacing locations, Bottom: stimulus train (S1, S2, S3). (C) Calculation of surviving tissue thickness surrounding the scar using SMLT metric. The schematic in the middle illustrates a cross section of the wall composed of scar and surviving tissue. The red lines are extended from the scar surface in the direction of the normal vector to the scar surface. The calculated local thickness of the surviving tissue is mapped onto the scar surface and displayed in endocardial and epicardial views on the right panel (see Methods for detailed description).
Figure 2
Figure 2
Examples of the distribution of viable tissue in the zone of infarct, as visible from short-axis slices of high-resolution LGE-MRI in three infarcted hearts (5,7,8) (A) Thin sub-endocardial layer of surviving tissue (red arrows), (B) Intramural viable tissue (yellow arrows) (C) sub-epicardial layer of surviving myocardium (blue arrows).
Figure 3
Figure 3
Visualization and characterization of surviving tissue surrounding the scar. (A) 3D geometries of 8 infarcted hearts with the scar surface color-coded with SMLT metric. The hearts are viewed from the posterolateral side such that the endocardial aspect of the infarct is visible. (B) Histograms of the occurrence of surviving tissue at different SMLT metric values, calculated in all the 8 hearts (left: normalized, and right: cumulative histograms).
Figure 4
Figure 4
A representative VT sustained primarily within a heterogeneous layer of sub-endocardial viable tissue (CL = 145 ms) shown in an endocardial view of the septum in heart 6. (A) 3D geometry (scar: dark gray, myocardium: transparent white) (B) 3D geometry with the scar color-coded with the SMLT metric. (C-E) Transmembrane voltage maps demonstrating time snapshots of tortuous wave propagation in one cycle of reentry. White arrows show wave direction. The reentry is primarily located in the subendocardial layer of tissue. (F) Pseudo-ECG. tref : reference time.
Figure 5
Figure 5
Reentry involving a sub-epicardial channel of viable tissue in heart 5 (CL = 230 ms). (A-D) Transmembrane voltage maps showing one cycle of reentry. The wave traverses the channel in (B) and (C); its exit from the channel is followed by a centrifugal activation of the tissue outside the scar in (D). The length of the epicardial channel is approximately 30 mm and the VT pathlength is 74 mm. A border layer around the scar has been rendered semi-transparent to visualize channel position. (E) Pseudo-ECG. tref : reference time.
Figure 6
Figure 6
An example of a reentry in heart 7 as viewed from the epicardium (CL = 240 ms). (A) Transmembrane voltage maps present snapshots during one cycle of reentry with a breakthrough on the epicardium. (B) (left) View of 3D model geometry (scar: dark; myocardium: transparent gray), (right) delineation of a portion of an intramural surviving tissue embedded inside the infarct (green) that participates in the reentry. The arrows point to the locations of wave entrance and exit from the surviving tissue. (C) Pseudo-ECG. tref is the reference time in which the voltage maps in (A) are shown with reference to.
Figure 7
Figure 7
Analysis of the surviving tissue along the VT pathways. (A,C) Maps of SMLT in two hearts with the 3D VT pathway loops in each case (myocardium: transparent gray). (B,D) Histograms of frequency of occurrence of a given SMLT value over the entire 3D scar surface (blue) and along the VT pathways (red) in each heart. (E) The same histograms as (B) and (D) but aggregated for all the hearts and VTs in this study. Shown are normalized (left) and cumulative (right) histograms.

References

    1. John RM, Tedrow UB, Koplan BA, Albert CM, Epstein LM, Sweeney MO, Miller AL, Michaud GF, Stevenson WG. Ventricular arrhythmias and sudden cardiac death. Lancet. 2012;380:1520–1529. - PubMed
    1. Janse MJ, Wit AL. Electrophysiological mechanisms of ventricular arrhythmias resulting from myocardial ischemia and infarction. Physiol Rev. 1989;69:1049–1169. - PubMed
    1. Kléber AG, Rudy Y. Basic Mechanisms of Cardiac Impulse Propagation and Associated Arrhythmias. Physiol Rev. 2009;84:431–488. - PubMed
    1. Josephson ME. Clinical Cardiac Electrophysiology: Techniques and Interpretations. Fourth. Lippincott Williams & Wilkins; 2008. pp. 446–642.
    1. de Bakker JM, van Capelle FJ, Janse MJ, Tasseron S, Vermeulen JT, de Jonge N, Lahpor JR. Slow conduction in the infarcted human heart. “Zigzag” course of activation. Circulation. 1993;88:915–926. - PubMed

Publication types

MeSH terms