. 2018 Sep;103(9):1557-1567.
doi: 10.3324/haematol.2017.185165. Epub 2018 Jun 7.

Impaired mitochondrial activity explains platelet dysfunction in thrombocytopenic cancer patients undergoing chemotherapy

Affiliations

Impaired mitochondrial activity explains platelet dysfunction in thrombocytopenic cancer patients undergoing chemotherapy

Constance C F M J Baaten et al. Haematologica. 2018 Sep.

Abstract

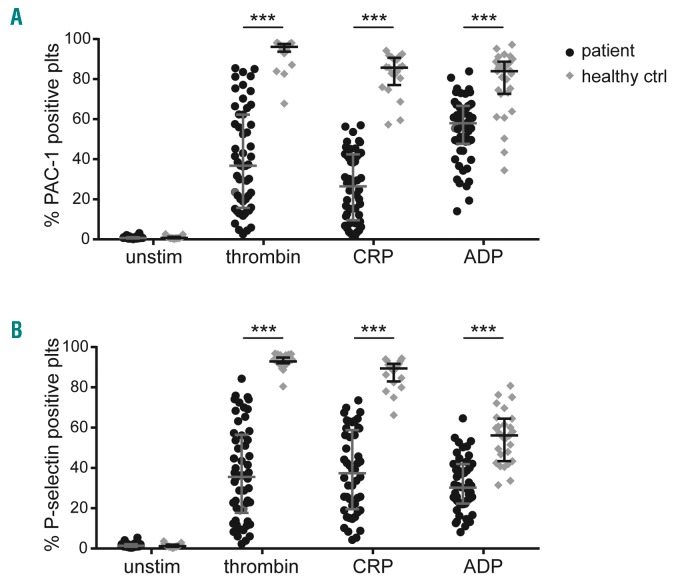
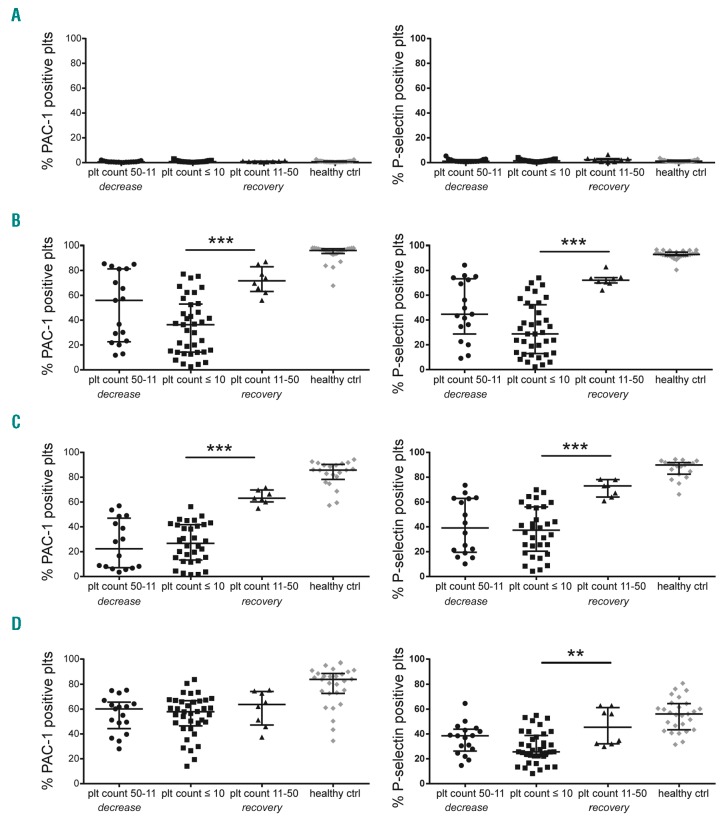
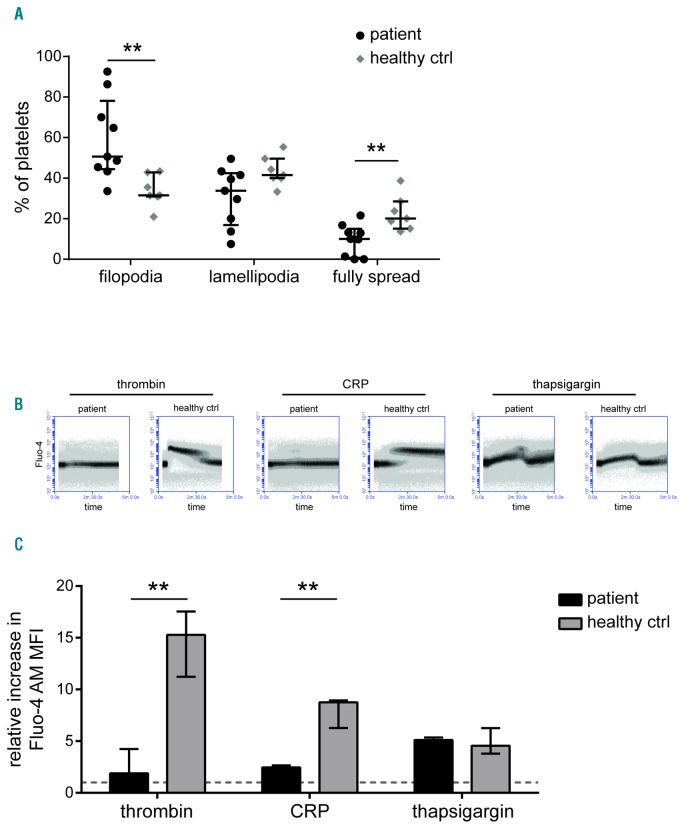
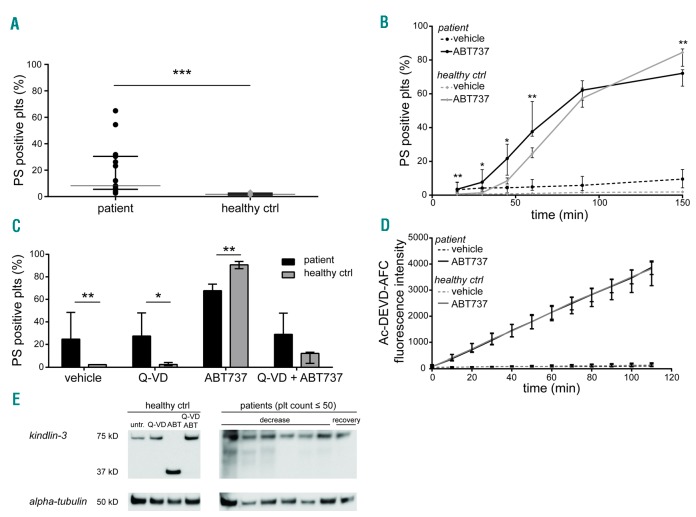
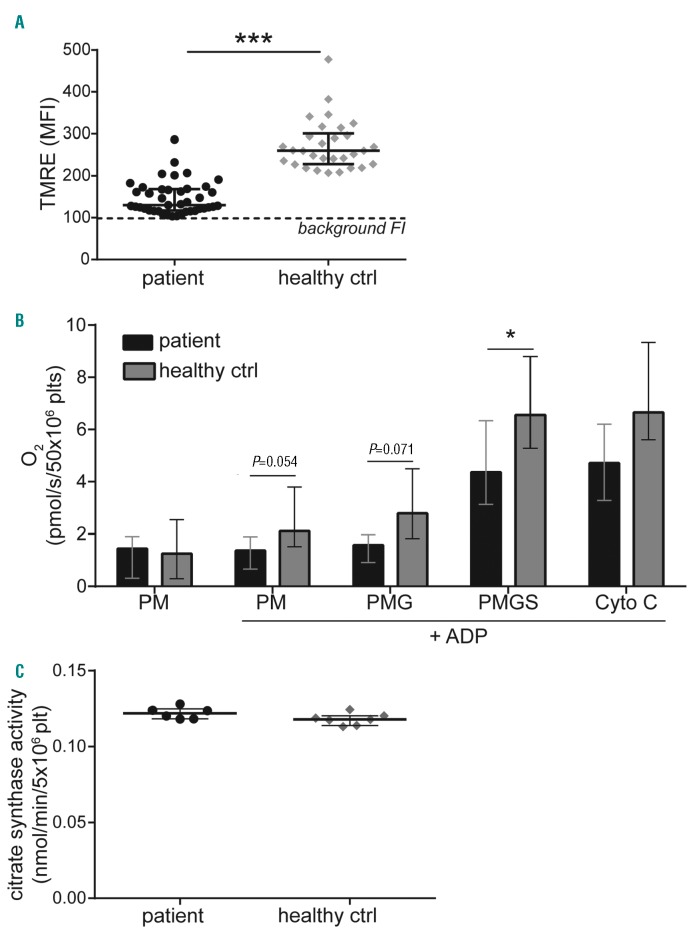
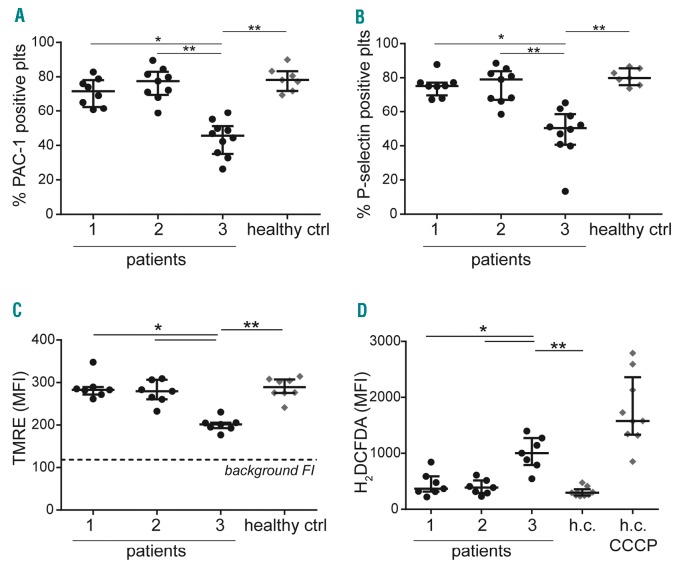
Severe thrombocytopenia (≤50×109 platelets/L) due to hematological malignancy and intensive chemotherapy is associated with an increased risk of clinically significant bleeding. Since the bleeding risk is not linked to the platelet count only, other hemostatic factors must be involved. We studied platelet function in 77 patients with acute leukemia, multiple myeloma or malignant lymphoma, who experienced chemotherapy-induced thrombocytopenia. Platelets from all patients - independent of disease or treatment type - were to a variable extent compromised in Ca2+ flux, integrin a β activation and P-selectin expression when stimulated with a panelIIbof3 agonists. The patients' platelets were also impaired in spreading on fibrinogen. Whereas the Ca2+ store content was unaffected, the patients' platelets showed ongoing phosphatidylserine exposure, which was not due to apoptotic caspase activity. Interestingly, mitochondrial function was markedly reduced in platelets from a representative subset of patients, as evidenced by a low mitochondrial membrane potential (P<0.001) and low oxygen consumption (P<0.05), while the mitochondrial content was normal. Moreover, the mitochondrial impairments coincided with elevated levels of reactive oxygen species (Spearman's rho=-0.459, P=0.012). Markedly, the impairment of platelet function only appeared after two days of chemotherapy, suggesting origination in the megakaryocytes. In patients with bone marrow recovery, platelet function improved. In conclusion, our findings disclose defective receptor signaling related to impaired mitochondrial bioenergetics, independent of apoptosis, in platelets from cancer patients treated with chemotherapy, explaining the low hemostatic potential of these patients.


Figures

Figure 1.
Figure 1.
Variable impairment of integrin aIIbβ3 activation and P-selectin expression in stimulated platelets from cancer patients with thrombocytopenia after chemotherapy. Washed platelets (10×109/L) from healthy control subjects (healthy ctrl) and thrombocytopenic patients receiving chemotherapy were activated with thrombin (4 nM), CRP-XL (10 μg/mL) or 2MeS-ADP (1 μM) in the presence of 2 mM CaCl2. After 15 min activation, integrin aIIbβ3 activation (A) and P-selectin expression (B) were measured by flow cytometry using PAC-1 and anti-P-selectin antibody, respectively. Medians with IQR; data from 52 patients (25 AML/ALL, 12 multiple myeloma, 13 lymphoma, two other), 27 healthy controls, ***P<0.001. CRP: collagen-related peptide; ADP: adenosine diphosphate.
Figure 2.
Figure 2.
Impaired platelet responsiveness in relation to phase of treatment and/or recovery. Platelet integrin aIIbβ3 activation and P-selectin expression were measured (see Figure 1). Patients (n=52) were divided into two categories: (i) decreasing platelet count 50-11 ×109/L (n=15) and (ii) decreasing platelet count ≤10 ×109/L (n=37). Furthermore, from a subset of patients a sample could be collected when the platelet count increased independently of platelet transfusion (iii): 11- 50 ×109/L (n=8). Data are expressed as % of platelets positive for PAC-1 or anti-P-selectin staining in the absence of stimulation (A), or after stimulation with thrombin (B), CRP-XL (C) or 2MeS-ADP (D). Medians with IQR for patients and healthy controls (n=27); **P<0.01 and ***P<0.001. plt: platelet.
Figure 3.
Figure 3.
Impaired platelet spreading and Ca2+ signaling of platelets from patients. (A) Platelets from patients or healthy controls were allowed to spread on a fibrinogen surface for 10 min, after which microscopic images were captured. Spreading state per platelet was classified in three stages based on morphology: (i) filopodia, (ii) lamellipodia, or (iii) fully spread. Percentages of platelets per category are shown. Medians (with IQR) for nine patients, seven control subjects. (B, C) Fluo-4- loaded platelets from patients (n=7) and controls (n=5) were stimulated with thrombin (4 nM), CRP-XL (10 μg/mL) or thapsigargin (0.5 μM) in the presence of 2 mM CaCl2. Changes in Fluo-4 fluorescence were measured in time by flow cytometry. (B) Representative Fluo-4 traces in time. (C) Relative increases in cytosolic Ca2+. Medians with IQR, **P<0.01. Overall platelet responsiveness of the patients was 31.5 – 57.9% (IQR). CRP: collagen-related peptide.
Figure 4.
Figure 4.
Increased PS exposure in platelets from patients receiving chemotherapy in the absence of apoptosis. Isolated platelets from patients and controls were incubated at 37°C for 90 min, and stained for PS exposure with FITC-annexin A5. (A) Percentages of PS-exposing platelets, (patients n=15, controls n=12). (B) PS exposure measured after indicated times with vehicle or 5 μM ABT-737 to induce apoptosis, (n=6-9). Platelets (10×109/L) from patients or controls were pretreated with caspase inhibitor Q-VD-OPh (10 μM), as indicated, and then stimulated with ABT-737 (5 μM) or vehicle. (C) Fractions of platelets with PS exposure, measured with FITC-annexin A5, (n=8). (D) Caspase-3 activity determined with a fluorometric assay, (n=4). (E) Absence of caspase-dependent kindlin-3 cleavage in western blots from patient platelets. Control platelets were stimulated with ABT-737 with(out) Q-VD-OPh pretreatment; patient platelets were analyzed during the decreasing and recovery phases of platelet count, (n=7). Overall platelet responsiveness of the patients was 30.5 – 48.4% (IQR). Medians with IQR, *P<0.05, **P<0.01 and ***P<0.001. plt: platelets.
Figure 5.
Figure 5.
Impaired mitochondrial bioenergetics in patient platelets. A) Initial screening of TMRE staining of washed platelets from patients. To assess the mitochondrial membrane potential, platelets were stained with TMRE and subsequently analyzed by flow cytometry. Shown are mean fluorescence intensities of TMRE ((n=39: treatment classes: A+B: n=10; A+B+C: n=5; B+C: n=7; C: n=13) and healthy controls (n=27)). B) High resolution respirometry to measure mitochondrial respiration in washed platelets from additionally included patients (n=7) and controls (n=9). Depicted is oxygen consumption due to sequential addition of saturating amounts of pyruvate (P), malate (M), ADP, glutamate (G), succinate (S) and cytochrome C (Cyto C). C) Citrate synthase activity in washed platelets from patients (n=6) and controls (n=7) to assess mitochondrial content. Medians with IQR, *P<0.05, ***P<0.001. Overall platelet responsiveness of the patients was 28.7– 46.9% (IQR). ADP: adenosine diphosphate.
Figure 6.
Figure 6.
Decreased responsiveness of patient platelets is accompanied by mitochondrial membrane depolarization and ROS production. Platelets (10×109/L) were isolated from healthy controls (healthy ctrl) and from patients at three time points; namely 1: directly before the start of chemotherapy, 2: at two days of chemotherapy and, 3: upon severe thrombocytopenia (count ≤50×109/L). Washed platelets were activated with thrombin (4 nM), CRP-XL (10 μg/mL) or 2MeS-ADP (1 μM) in the presence of 2 mM CaCl2. After 15 min activation, integrin aIIbβ3 activation (A) and P-selectin expression (B) were measured by flow cytometry using labeled PAC-1 and anti-P-selectin antibody, respectively. Depicted is mean platelet responsiveness to thrombin, CRP-XL and ADP. Platelet samples were loaded with TMRE (C) to assess mitochondrial membrane potential, indicative of mitochondrial function, or with H2DCFDA (D) to measure ROS levels. Platelets from healthy controls were treated with CCCP as a positive control (h.c. CCCP). Medians with interquartile ranges (IQR); n=7-10 (patients) and n=7 (healthy controls), *P<0.05,**P<0.01.

Similar articles

Cited by

References

    1. Versteeg HH, Heemskerk JW, Levi M, Reitsma PH. New fundamentals in hemostasis. Physiol Rev. 2013;93(1):327–358. - PubMed
    1. Apelseth TO, Hervig T, Bruserud Ø. Current practice and future directions for optimization of platelet transfusions in patients with severe therapy-induced cytopenia. Blood Rev. 2011;25(3):113–122. - PubMed
    1. Stanworth SJ, Estcourt LJ, Powter G, et al. A no-prophylaxis platelet-transfusion strategy for hematologic cancers. N Engl J Med. 2013;368(19):1771–1780. - PubMed
    1. Estcourt LJ, Stanworth SJ, Doree C, et al. Prophylactic platelet transfusion for prevention of bleeding in patients with haematological disorders after chemotherapy and stem cell transplantation. Cochrane Database Syst Rev. 2012;16(5): CD004269. - PMC - PubMed
    1. Wandt H, Schaefer-Eckart K, Wendeling K, et al. Therapeutic platelet transfusion versus routine prophylactic transfusion in patients with haematological malignancies: an open-label, multicentre, randomised study. Lancet. 2012;380(9850):1309–1316. - PubMed

Publication types

MeSH terms

LinkOut - more resources