. 2018 Jul 13;293(28):10895-10910.
doi: 10.1074/jbc.RA118.003650. Epub 2018 Jun 7.

Structure-based stabilization of insulin as a therapeutic protein assembly via enhanced aromatic-aromatic interactions

Affiliations

Structure-based stabilization of insulin as a therapeutic protein assembly via enhanced aromatic-aromatic interactions

Nischay K Rege et al. J Biol Chem. .

Abstract

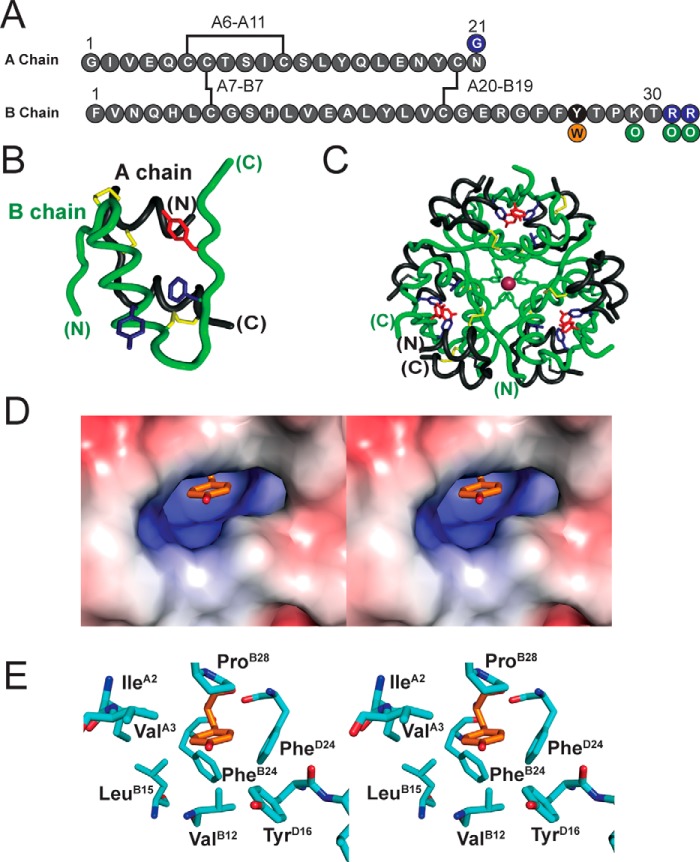
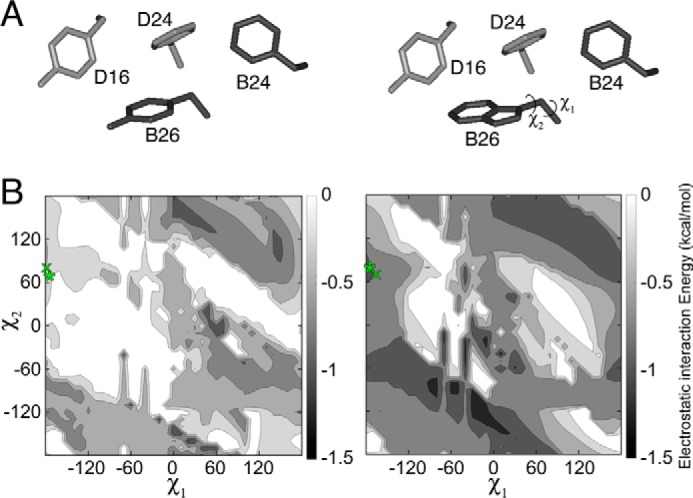
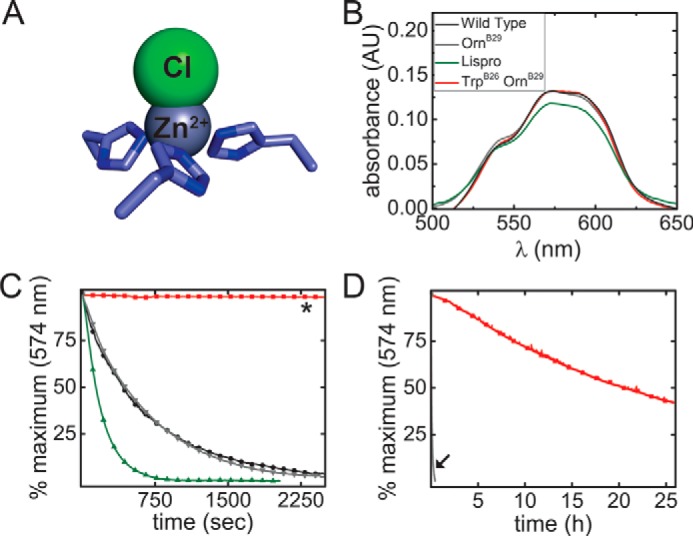
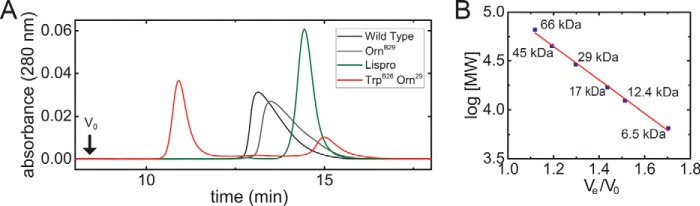
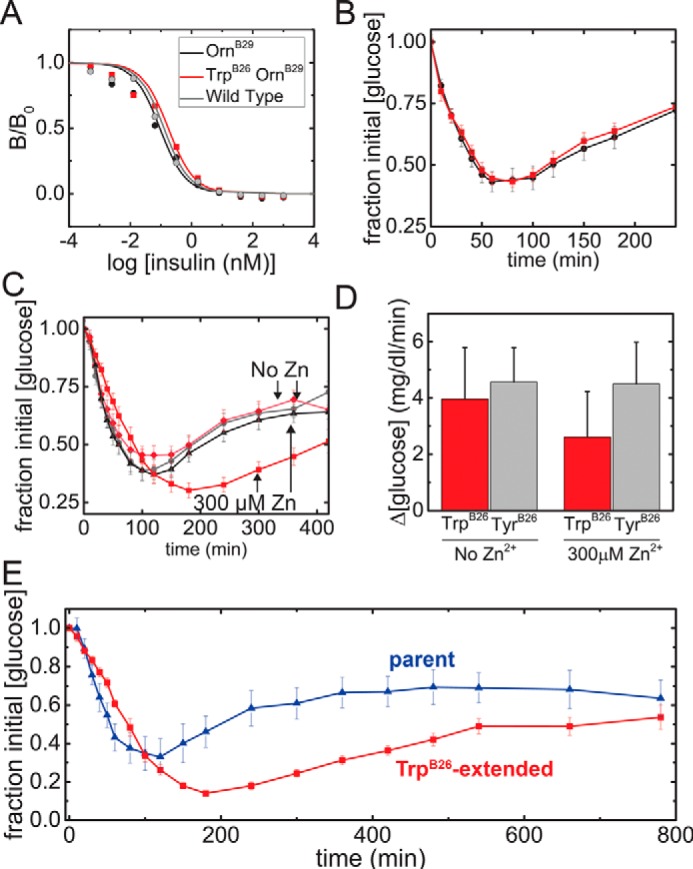
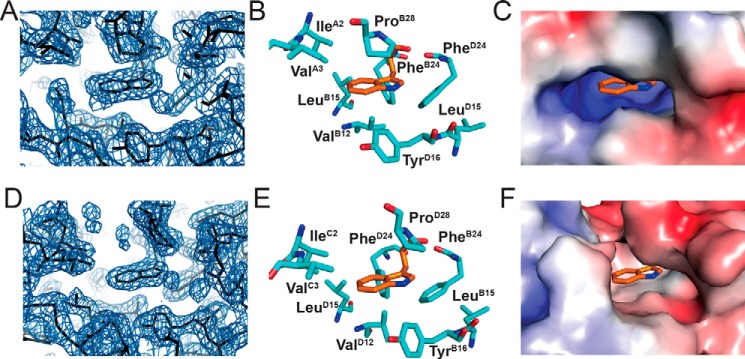
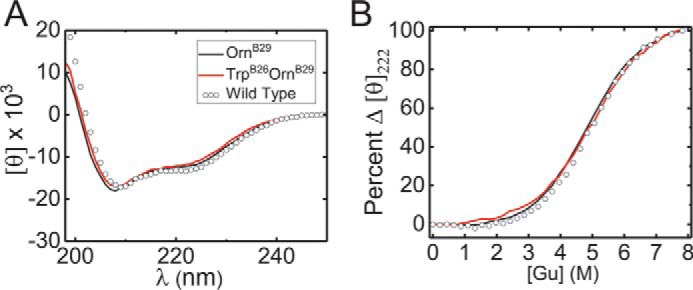
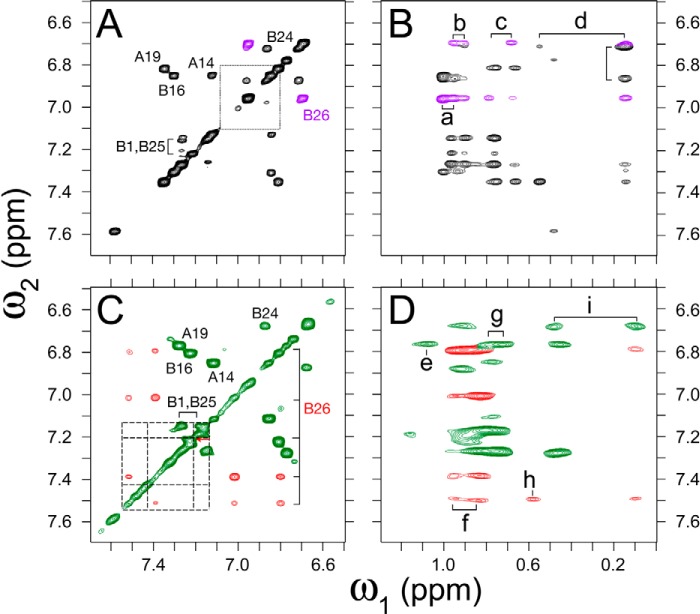
Key contributions to protein structure and stability are provided by weakly polar interactions, which arise from asymmetric electronic distributions within amino acids and peptide bonds. Of particular interest are aromatic side chains whose directional π-systems commonly stabilize protein interiors and interfaces. Here, we consider aromatic-aromatic interactions within a model protein assembly: the dimer interface of insulin. Semi-classical simulations of aromatic-aromatic interactions at this interface suggested that substitution of residue TyrB26 by Trp would preserve native structure while enhancing dimerization (and hence hexamer stability). The crystal structure of a [TrpB26]insulin analog (determined as a T3Rf3 zinc hexamer at a resolution of 2.25 Å) was observed to be essentially identical to that of WT insulin. Remarkably and yet in general accordance with theoretical expectations, spectroscopic studies demonstrated a 150-fold increase in the in vitro lifetime of the variant hexamer, a critical pharmacokinetic parameter influencing design of long-acting formulations. Functional studies in diabetic rats indeed revealed prolonged action following subcutaneous injection. The potency of the TrpB26-modified analog was equal to or greater than an unmodified control. Thus, exploiting a general quantum-chemical feature of protein structure and stability, our results exemplify a mechanism-based approach to the optimization of a therapeutic protein assembly.

Keywords: insulin; molecular dynamics; molecular pharmacology; protein design; protein self-assembly.


Conflict of interest statement

M. A. W. has equity in Thermalin, Inc. (Cleveland, OH) where he serves as Chief Innovation Officer; he has also been a consultant to Merck Research Laboratories and DEKA Research & Development Corp. N. F. B. P. is a consultant to Thermalin, Inc. F. I.-B. serves has equity in Thermalin, Inc. and is a consultant to Sanofi and Novo Nordisk

Figures

Figure 1.
Figure 1.
Structural overview of insulin. A, sequence of insulin with disulfide bridges in black. TyrB26 is highlighted in black; the present TyrB26 → Trp substitution is orange; and modifications in pI-shifted clinical analog glargine in purple. Our semisynthetic pI-shifted analog contained Orn (green) instead of Lys or Arg. B, structure of an insulin monomer; the A chain is shown in black and B chain in green. TyrB26 is red, whereas PheB24 and TyrB16 are blue (PDB code 4INS). C, structure of zinc-coordinated insulin hexamer (T6 state), a trimer of dimers; TyrB26, PheB24, and TyrB16 are color-coded as in B. D, stereo view showing TyrB26 (sticks) in a cavity within insulin dimer (extracted from T3Rf3 hexamer, PDB code 1TRZ). E, corresponding stick model with residues labeled.
Figure 2.
Figure 2.
Molecular simulations of aromatic interactions in the insulin dimer. A, aromatic–aromatic interactions across insulin's dimer interface involve PheB24, TyrB16, PheD24 (sticks) and either TyrD26 (left) or TrpD26 (right). Residues were extracted from T6 structure 4INS. B, contour maps depicting empirical interaction energies between B26 (Tyr on left and Trp on right) at varying χ1 and χ2 angles and the other three residues shown in A. The orientation of TyrB26 or TrpB26 in the WT or variant crystal structure is indicated by a green “x”; orientation of TyrB26 or TrpB26 in the local model is indicated by a green asterisk.
Figure 3.
Figure 3.
Hexamer dissociation of TrpB26 analog. A, tetrahedral Zn2+-coordination site in R6 insulin hexamer (ball-and-stick model): three HisB10 side chains and one chloride ion. B, absorbance spectra of d–d bands in corresponding Co2+ complex; the color code is indicated. C, hexamer dissociation curves as monitored at 574 nm after addition of excess EDTA; the color code is as in B. The lifetime of the [TrpB26,OrnB29]insulin hexamer was markedly prolonged (asterisk). D, dissociation of TrpB26,OrnB29 hexamer from 0 to 8000 s in relationship to that of parent [OrnB29]insulin (black arrow). Half-lives are given in Table 1.
Figure 4.
Figure 4.
Size exclusion chromatography of TrpB26 hexamer. A, SEC chromatogram of insulin analogs in the presence of zinc and phenol. The void volume (V0, black arrow) was defined by thyroglobulin (molecular mass 669 kDa). B, plot of log(molecular weight) versus elution ratio (Ve/V0) of molecular weight standards. Linear relationship between log[MW] to elution ratio (Ve/V0) is indicated by the red line with coefficient of determination (R2) 0.996 and parameters log[molecular weight] = −1.71 × (Ve/V0) + 6.7012. Elution times of molecular weight standards are indicated by blue squares (labeled by molecular weight). Identity of molecular mass standards is as follows: 66 kDa, BSA; 45 kDa ovalbumin; 20 kDa, carbonic anhydrase, 17 kDa, myosin light chain; 12.4; cytochrome c, 6.5 IGF-I. Calculated Mr are given in Table 1.
Figure 5.
Figure 5.
Pharmacology of TrpB26 analog. A, receptor-binding affinities (isoform B). The affinity of [TrpB26,OrnB29]insulin was reduced by 2-fold relative to [OrnB29]insulin (respective Kd estimates 0.14 (±0.03) and 0.07 (±0.02) nm). Color code is indicated in the inset. B, time course of [blood glucose] following i.v. injection in rats (n = 15); color code as in A. C, time course of [blood glucose] following SQ injection in the absence or presence of 0.3 mm ZnCl2 (n = 18). D, histogram summarizing the rate of fall of [blood glucose] over the first 30 min in C, black bars indicate S.D. E, time course of [blood glucose] following SQ injection of pI-shifted analogs: [GlyA21, OrnB29,OrnB31,Orn32]insulin, and its TrpB26 derivative (n = 6; color code in panel).
Figure 6.
Figure 6.
Crystal structure of [TrpB26,OrnB29]insulin. A, electron density of TrpB26 in T-state protomer showing the surrounding density in TRf asymmetric unit (contour level 2.0 Å). B, stick model corresponding to map in A; TrpB26 is orange. C, surfaces of residues surrounding TrpB26 (sticks) as indicated above. D–F, corresponding map and models of TrpB26 in the R state protomer.
Figure 7.
Figure 7.
Thermodynamic stability of [TrpB26,OrnB29]insulin. A, CD spectra of [TrpB26,OrnB29]insulin, [OrnB29]insulin, and WT insulin. B, guanidine denaturation assays of insulin analogs monitored by ellipticity at 222 nm; color code as in A. Stabilities are given in Table 2.
Figure 8.
Figure 8.
Homonuclear 2D NMR of a TrpB26 analog. 2D NMR studies of insulin analogs indicate similar TyrB26- and TrpB26 environments. A and B, spectra of parent monomer insulin lispro ([LysB28,ProB29]insulin): A, aromatic region of TOCSY spectrum with TyrB26 cross-peaks (magenta) shown relative to the Tyr spin system in free octapeptide GFFYTKPT (dotted lines); and B, region of NOESY spectrum showing contacts between aromatic protons (vertical axis, ω2) and methyl groups (horizontal axis, ω1). C and D, spectra of TrpB26 analog of insulin lispro: C, aromatic TOCSY spectrum highlighting TrpB26 cross-peaks (red) relative to the Trp spin system in free octapeptide GFFWTKPT (dashed lines) and D, region of NOESY spectrum corresponding to B. B26-related NOEs are shown in red. Cross-peak assignments: (a) γ-CH3 ValA3, (b) γ-CH3 ValB12, (c) γ-CH2, γ-CH3 IleA2, (d) δ-CH3 LeuB15, (e) γ-CH3 ValA3, (f) γ-CH3 ValB12, (g) γ-CH2, γ-CH3 IleA2, (h) δ-CH3 IleA2, and (i) δ-CH3 LeuB15. TOCSY mixing times in spectra A and C were 55 ms; NOESY mixing times in B and D were 150 ms.
Figure 9.
Figure 9.
Binding surface of TyrB26 on an IR fragment. A, model of WT insulin (in classical T-state) overlaid on the structure of insulin bound to an IR fragment (PDB entry 4OGA). The L1 domain and part of the CR domain are shown in powder blue, whereas αCT is shown in purple. PheB24 and TyrB26 are, respectively, shown as gray and red sticks. The B-chain of IR-bound insulin is shown in dark gray (B6–B19) or black (B20–B27); the green tube indicates a classical location within overlay of residues B20–B30 (green arrow), thereby highlighting the steric clash of B26–B30 with αCT. Insertion of the insulin B20–B27 segment between L1 and αCT was associated with a small rotation of the B20–B23 β-turn and changes in main chain dihedral angles flanking B24. B, stick representation of B-chain residues B20–B27 packed between αCT and the L1 β2 strand. Color code in insulin segment: carbon atoms (green), nitrogen (blue), and oxygen (red). Residues B8–B19 are shown as a black ribbon, and the A-chain is shown as a yellow ribbon. Key contact surfaces of αCT with B24–B26 are highlighted in magenta and L1 with B24–B26 are highlighted in cyan. C, stereo view of the environment of TyrB26 within its binding site. Neighboring side chains in L1 and αCT are as labeled. This figure was adapted from Ref. with permission of the authors.

References

    1. Burley S. K., and Petsko G. A. (1988) Weakly polar interaction in proteins. Adv. Protein Chem. 39, 125–189 - PubMed
    1. Burley S. K., and Petsko G. A. (1985) Aromatic-aromatic interaction: a mechanism of protein structure stabilization. Science 229, 23–28 10.1126/science.3892686 - DOI - PubMed
    1. Waters M. L. (2002) Aromatic interactions in model systems. Curr. Opin. Chem. Biol. 6, 736–741 10.1016/S1367-5931(02)00359-9 - DOI - PubMed
    1. Blundell T. L., Dodson G. G., Hodgkin D. C., and Mercola D. A. (1972) Insulin: the structure in the crystal and its reflection in chemistry and biology. Adv. Protein Chem. 26, 279–402 10.1016/S0065-3233(08)60143-6 - DOI
    1. Salsali A., and Nathan M. (2006) A review of types 1 and 2 diabetes mellitus and their treatment with insulin. Am. J. Ther. 13, 349–361 10.1097/00045391-200607000-00012 - DOI - PubMed

Publication types