. 2018 Jun 7;9(6):685.
doi: 10.1038/s41419-018-0740-5.

Inflammation, neurodegeneration and protein aggregation in the retina as ocular biomarkers for Alzheimer's disease in the 3xTg-AD mouse model

Affiliations

Inflammation, neurodegeneration and protein aggregation in the retina as ocular biomarkers for Alzheimer's disease in the 3xTg-AD mouse model

Alfonso Grimaldi et al. Cell Death Dis. .

Abstract

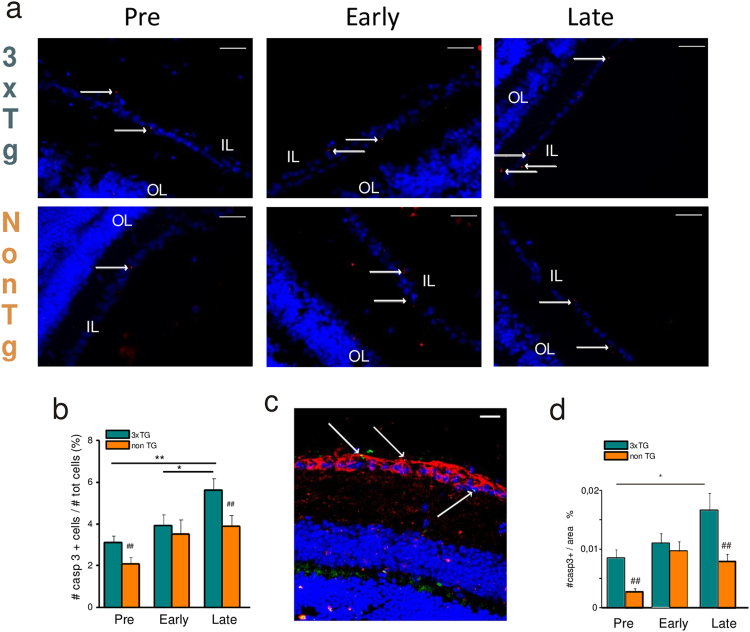
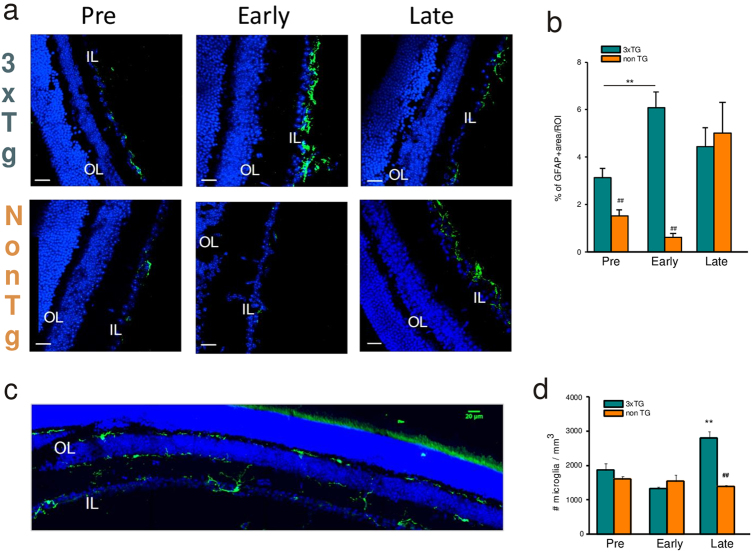
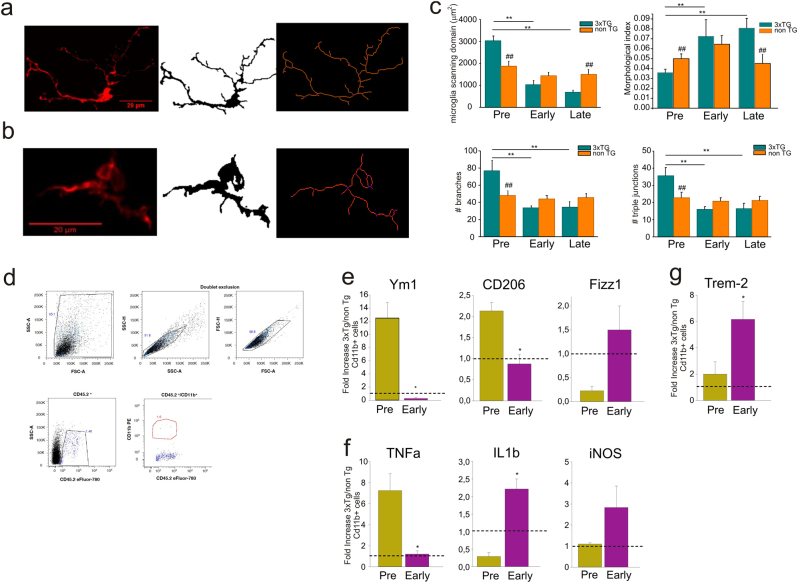
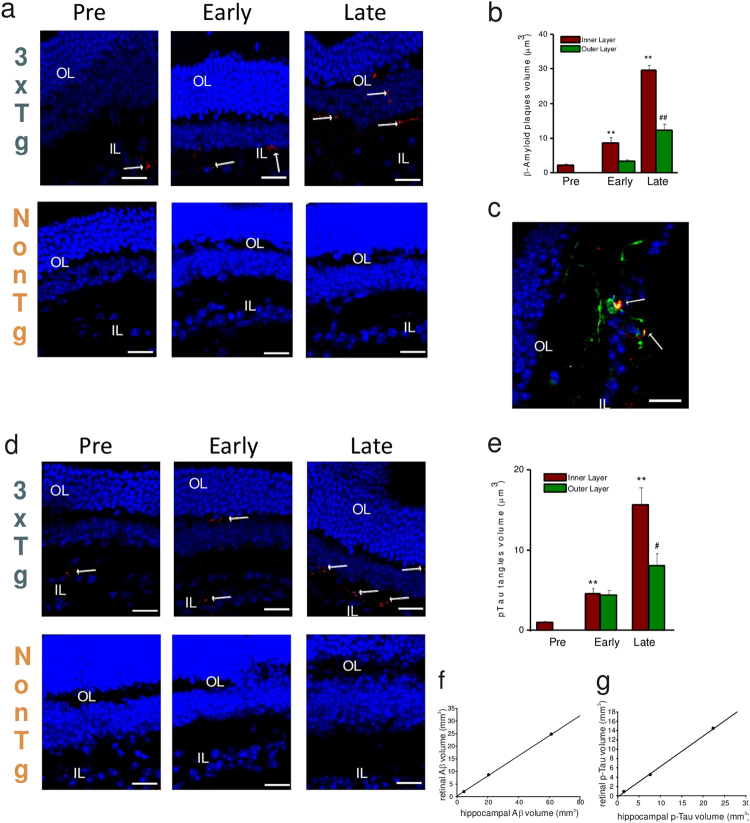
Alzheimer's disease (AD) is the most common cause of dementia in the elderly. In the pathogenesis of AD a pivotal role is played by two neurotoxic proteins that aggregate and accumulate in the central nervous system: amyloid beta and hyper-phosphorylated tau. Accumulation of extracellular amyloid beta plaques and intracellular hyper-phosphorylated tau tangles, and consequent neuronal loss begins 10-15 years before any cognitive impairment. In addition to cognitive and behavioral deficits, sensorial abnormalities have been described in AD patients and in some AD transgenic mouse models. Retina can be considered a simple model of the brain, as some pathological changes and therapeutic strategies from the brain may be observed or applicable to the retina. Here we propose new retinal biomarkers that could anticipate the AD diagnosis and help the beginning and the follow-up of possible future treatments. We analyzed retinal tissue of triple-transgenic AD mouse model (3xTg-AD) for the presence of pathological hallmarks during disease progression. We found the presence of amyloid beta plaques, tau tangles, neurodegeneration, and astrogliosis in the retinal ganglion cell layer of 3xTg-AD mice, already at pre-symptomatic stage. Moreover, retinal microglia in pre-symptomatic mice showed a ramified, anti-inflammatory phenotype which, during disease progression, switches to a pro-inflammatory, less ramified one, becoming neurotoxic. We hypothesize retina as a window through which monitor AD-related neurodegeneration process.


Conflict of interest statement

The authors declare that they have no conflict of interest.

Figures

Fig. 1
Fig. 1. Retinal neurodegeneration starts at pre-symptomatic stage in 3xTg-AD mice.
a Retinal slices were immunolabeled with anti-cleaved caspase-3 antibody (red) and Hoechst for nuclei visualization (blue) at different ages of 3xTg-AD and non-Tg mice. b Percentage of cleaved caspase-3-positive cells (**p < 0.01 pre vs late; *p < 0.05 pre vs early; p = 0.12 early vs late; n = 16 fields/four slices for each condition; two-way ANOVA, Holm-Sidak) and comparison with age-matched non-Tg mice (##p < 0.01; n = 16 fields/four slices for each condition; two-way ANOVA, Holm-Sidak). c Representative image of retinal slice immunolabeled with anti-cleaved-caspase-3 antibody (green), anti Tuj-1 (red), and Hoechst for nuclei visualization (blue). d Percentage of cleaved caspase-3-positive cells (**p < 0.001 pre vs late; *p < 0.05 pre vs early; p = 0.15 early vs late; n = 16 fields/four slices for each condition; two-way ANOVA, Holm-Sidak) and comparison with age-matched non-Tg mice in hippocampal area (##p < 0.01; n = 16 fields/four slices for each condition; two-way ANOVA, Holm-Sidak)
Fig. 2
Fig. 2. Glial cells density is differently modulated during AD progression.
a Retinal slices were immunolabeled with anti-GFAP antibody (green) and Hoechst for nuclei visualization (blue) at different ages of 3xTg-AD and non-Tg mice and density of GFAP signal was quantified as shown in b (**p < 0.01 pre vs early; n = 16 fields/four slices for each condition; two-way ANOVA, Holm-Sidak; ##p < 0.01 for comparison with age-matched non-Tg mice, two-way ANOVA, Holm-Sidak). c Representative multiarea image of retinal slice immunolabeled with anti-Iba1 antibody (green) and Hoechst for nuclei visualization (blue); density of Iba1+ cells was quantified as shown in d (**p < 0.01 vs 3xTg-AD pre; ##p < 0.01 vs age-matched non-Tg mice, n = 16 fields/four slices for each condition, two-way ANOVA, Holm-Sidak method for multiple comparison)
Fig. 3
Fig. 3. Microglia activation state changes already at pre-symptomatic stage in 3xTg-AD mice.
Representative skeletonized images of Iba1+ microglial cell in retinal slices of a 3xTg-AD and b non-Tg mice. c Morphological parameters analyzed for microglia cells at different stages of AD show a more ramified retinal microglia morphology already at pre-symptomatic stage (**p < 0.01 vs 3xTg-AD pre; ##p < 0.01 vs age-matched non-Tg mice; n = 40, two-way ANOVA). d Gate strategy for retinal microglia cells sorting. Real-time experiment for the mRNA expression of e anti- and f pro-inflammatory genes and g TREM-2; data are mean ± s.e.m. of four different experiments and expressed as fold-increased expression of 3xTg-AD mice vs. respective age-matched non-Tg mice (*p < 0.05 vs respective non-Tg value)
Fig. 4
Fig. 4. Amyloid beta plaques and pTau tangles are present in the retinas of pre-symptomatic 3xTg-AD mice.
a Representative images of retinal slices immunolabeled with anti-Aβ antibody (red) and Hoechst for nuclei visualization (blue) at different ages of 3xTg-AD and non-Tg mice; plaque dimension was quantified as shown in b (**p < 0.01 vs pre in the inner layer; ##p < 0.01 vs early in the outer layer, n = 16 fields/four slices for each condition). c Representative image of retinal slice immunolabeled with anti-Aβ antibody (red), Iba1 (green), and Hoechst for nuclei visualization (blue), indicating that microglia is strictly connected to Aβ plaques emerging in retinal layers. d Representative images of retinal slice immunolabeled with anti-pTau antibody (red) and Hoechst for nuclei visualization (blue) at different ages of 3xTg-AD and non-Tg mice; tangles dimension was quantified as shown in e (**p < 0.01 vs pre in the inner layer; ##p < 0.01 vs early in the outer layer, n = 16 fields/four slices for each condition). f Correlation plot of Aβ plaque volume in hippocampal area (x axis) vs retina (y axis) of 3xTg-AD mice during disease progression; n = 16 fields/four slices for each condition, data are mean cumulative of different PNWs referred to the same AD stage; correlation coefficient: pre 0.531, early 1.00, late 0.916. g Correlation plot of pTau tangle volume in hippocampal area (x axis) vs retina (y axis) of 3xTg-AD mice during disease progression; n = 16 fields/four slices for each condition, data are mean cumulative of different PNWs referred to the same AD stage; correlation coefficient: pre 0.597, early 1.00, late 0.909

References

    1. Lim JK, et al. The eye as a biomarker for Alzheimer’s disease. Front. Neurosci. 2016;10:536. doi: 10.3389/fnins.2016.00536. - DOI - PMC - PubMed
    1. WHO. Dementia: a Public Health Priority (World Health Organization, Geneva, 2012).
    1. Holtzman DM, Morris JC, Goate AM. Alzheimer’s disease: the challenge of the second century. Sci. Transl. Med. 2011;3:77sr1. - PMC - PubMed
    1. Dubois B, et al. Advancing research diagnostic criteria for Alzheimer’s disease: the IWG-2 criteria. Lancet Neurol. 2014;13:614–629. doi: 10.1016/S1474-4422(14)70090-0. - DOI - PubMed
    1. McKhann GM, et al. The diagnosis of dementia due to Alzheimer’s disease: recommendations from the National Institute on Aging-Alzheimer’s Association workgroups on diagnostic guidelines for Alzheimer’s disease. Alzheimers Dement. 2011;7:263–269. doi: 10.1016/j.jalz.2011.03.005. - DOI - PMC - PubMed

Publication types

MeSH terms