. 2018 May 24:9:515.
doi: 10.3389/fphys.2018.00515. eCollection 2018.

Inhibition of the Activin Receptor Type-2B Pathway Restores Regenerative Capacity in Satellite Cell-Depleted Skeletal Muscle

Affiliations

Inhibition of the Activin Receptor Type-2B Pathway Restores Regenerative Capacity in Satellite Cell-Depleted Skeletal Muscle

Luigi Formicola et al. Front Physiol. .

Abstract

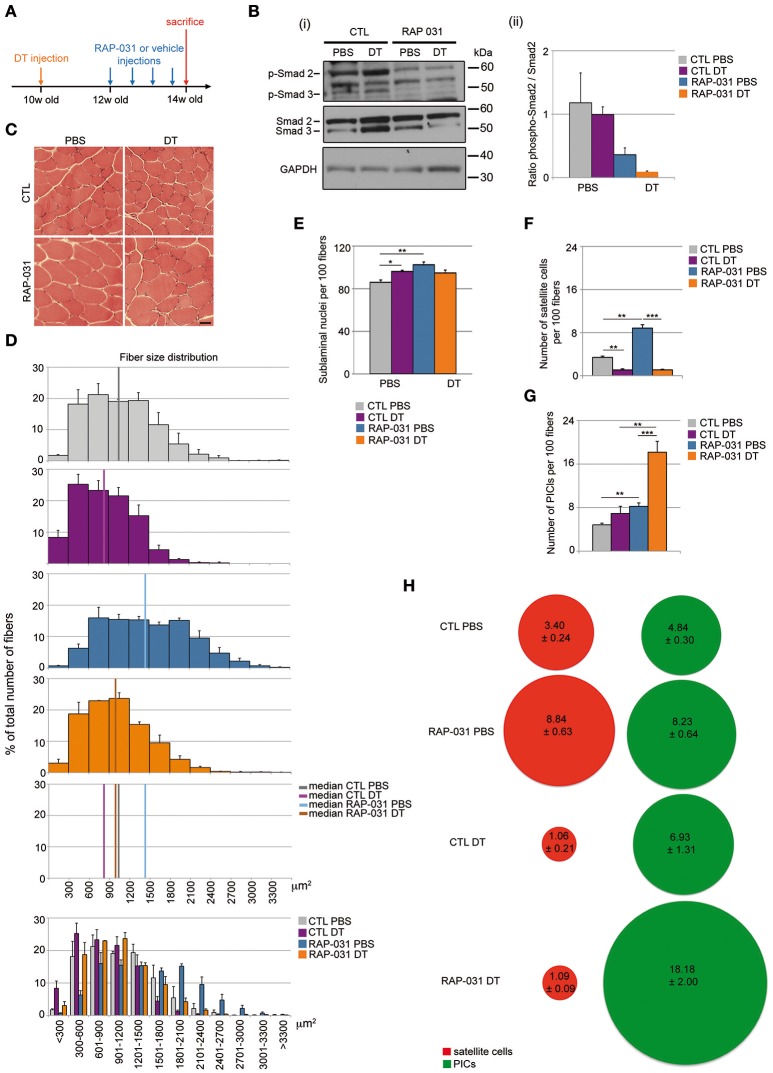
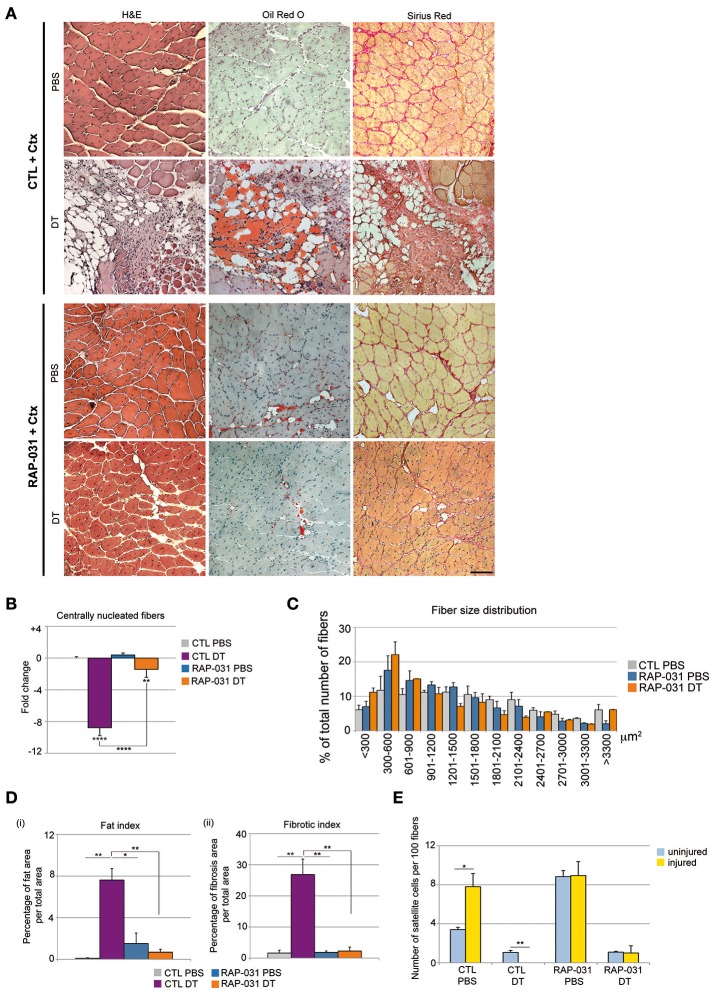
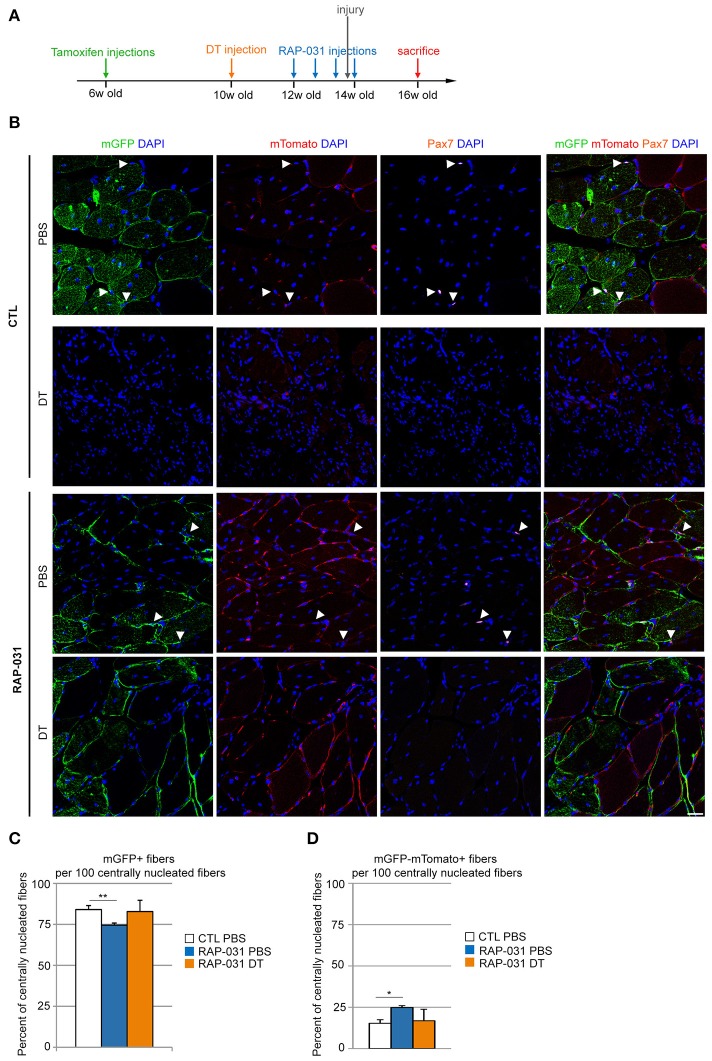
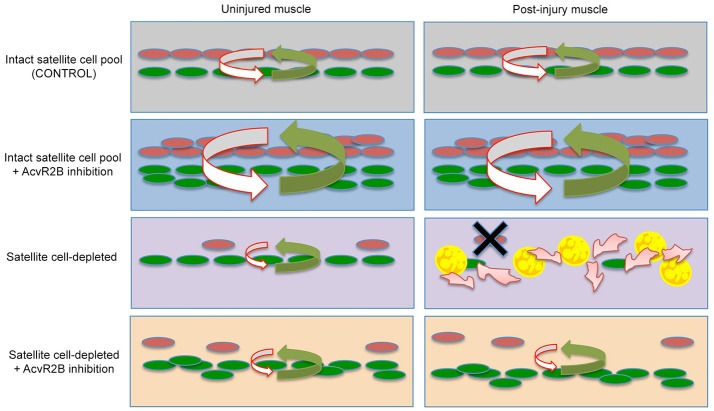
Degenerative myopathies typically display a decline in satellite cells coupled with a replacement of muscle fibers by fat and fibrosis. During this pathological remodeling, satellite cells are present at lower numbers and do not display a proper regenerative function. Whether a decline in satellite cells directly contributes to disease progression or is a secondary result is unknown. In order to dissect these processes, we used a genetic model to reduce the satellite cell population by ~70-80% which leads to a nearly complete loss of regenerative potential. We observe that while no overt tissue damage is observed following satellite cell depletion, muscle fibers atrophy accompanied by changes in the stem cell niche cellular composition. Treatment of these mice with an Activin receptor type-2B (AcvR2B) pathway blocker reverses muscle fiber atrophy as expected, but also restores regenerative potential of the remaining satellite cells. These findings demonstrate that in addition to controlling fiber size, the AcvR2B pathway acts to regulate the muscle stem cell niche providing a more favorable environment for muscle regeneration.

Keywords: TGFβ signaling; muscle atrophy; muscle regeneration; muscle stem cell niche; satellite cells.


Figures

Figure 1
Figure 1
RAP-031 treatment rescues the reduction of muscle fiber size induced by satellite cell depletion and increases PICs in satellite cell-depleted muscle. (A) Strategy: the right TA of 10 week-old Pax7DTR/+ males was injected with diphteria toxin (DT) to deplete satellite cells while the contralateral muscle was injected with PBS 2 weeks before RAP-031 treatment. Mice were intraperitoneally injected with RAP-031 or vehicle (CTL) twice a week for 2 weeks and sacrificed 14 days after the first injection. (B) Western Blot of TA protein extracts with antibodies against phospho-Smad2/3, total Smad2/3 and GAPDH. (i) Representative image of the blots. Molecular size in kDa is shown on the right side. (ii) Ratio between levels of phospho-Smad2 and levels of total Smad2. The graph shows a marked reduction in the ratio pSmad2/Smad2 in RAP-031 muscles, indicating an inhibition of the AcvR2B pathway following systemic RAP-031 treatment. N = 2 muscles per group. (C) Cross-sections images of TA muscles from CTL (Upper) or RAP-031 (Lower) mice injected with PBS (Left) or DT (Right) stained with hematoxylin and eosin. Scale bar, 60 μm. (D) Fiber size distribution in CTL PBS (gray), CTL DT (purple), RAP-031 PBS (blue), and RAP-031 DT (orange) TAs. RAP-031 treatment rescued the reduction of muscle fiber size induced by satellite cell depletion. Values represent the mean number ± s.e.m. per 100 fibers for each size. N = 3 animals for each group. Median of fiber area distributions are shown in the graphs. (E) Quantification of the number of sublaminal nuclei per 100 fibers in TA from CTL and RAP-031 mice injected with PBS or DT. RAP-031 treatment did not result in myonuclei addition when satellite cells are depleted. Values represent the mean number ± s.e.m. per 100 fibers. At least 300 fibers from randomly chosen fields were counted for each animal, n = 3 animals were considered for each group. (F,G) Quantification of satellite cells (E) and PICs (F) per 100 fibers in TA from CTL and RAP-031 mice injected with PBS or DT. (H) Ratio between PICs (green) and satellite cells (red) per 100 fibers in TA from CTL and RAP-031 mice injected with PBS or DT was profoundly altered in DT-injected mice after RAP-031 treatment. In (E–G), satellite cells were determined as M-Cadherinpos cells underneath the basal lamina, PICs were determined as interstitial PW1pos M-Cadherinneg cells. In (E–G), values represent the mean number of positive cells ± s.e.m. per 100 fibers. At least 300 fibers from randomly chosen fields were counted for each animal, n = 3 animals were considered for each group. For all values, *p < 0.05, **p < 0.01, and ***p < 0.001.
Figure 2
Figure 2
AcvR2B pathway inhibition improves overall fiber regeneration and ameliorates tissue homeostasis in injured satellite cell-depleted muscles. (A) Cross-sections of TA muscle from CTL (Upper) and RAP-031 (Lower) Pax7DTR/+ mice injected with DT or PBS stained with haematoxylin and eosin (Left), Oil-Red O (Middle) and Sirius Red (Right). Regeneration is more efficient in RAP-031 DT mice as compared to CTL DT mice, with a marked reduction in fat and fibrotic tissue deposition. Scale bar, 85 μm. (B) Quantitative analysis of regenerative capacity of TA muscles shown in (A). The number of centrally nucleated fibers per field in TAs from CTL mice injected with PBS was considered as the baseline (zero) and values represent the fold change ± s.e.m. normalized accordingly. Muscle fiber regeneration is significantly rescued in RAP-031 DT mice as compared to CTL DT mice. Five randomly chosen fields from one mid-belly TA section were analyzed for each animal, n = 3 animals were analyzed for each group. (C) Fiber size distribution in CTL PBS (gray), RAP-031 PBS (blue), and RAP-031 DT (orange) TAs. Satellite cell-depleted muscles exposed to RAP-031 before injury exhibited regenerated fibers with a reduced size as compared to intact muscles. Values represent the mean number ± s.e.m. per 100 fibers for each size. N = 3 animals for each group. (D) Quantitative analysis of fat (i) and fibrotic (ii) areas of muscles showed in (A). One mid-belly TA section was analyzed with ImageJ software for each animal and n = 3 animals were analyzed for each group. Fat areas were determined by Oil-Red O staining and fibrotic areas were determined by Sirius-Red staining. Values represent the percentage of fat (i) or fibrotic (ii) area on whole muscle area. (E) Quantification of satellite cells per 100 fibers in TA from uninjured (blue) and injured (yellow) Pax7DTR/+ CTL and RAP-031 mice injected with PBS or DT. Satellite cells were undetectable after injury in CTL DT muscle, however RAP-031 treatment was able to prevent satellite cell loss. Satellite cells were determined as Pax7pos cells underneath the basal lamina. At least 5 randomly chosen fields, corresponding to at least 300 fibers, were counted for each animal, n = 3 animals were considered for each group. *p < 0.05, **p < 0.01, ****p < 0.001.
Figure 3
Figure 3
Regeneration in satellite cell-depleted muscles following AcvR2B pathway inhibition is mainly executed by the residual satellite cells. (A) Strategy: 6 week-old Pax7DTR/+:Pax7CreERT2:ROSAmTmG mice were injected with tamoxifen to label satellite cells. 4 weeks later, the right TA was injected with DT to deplete the satellite cell pool. The contralateral muscle was injected with PBS. After 2 weeks, mice were injected with either RAP-031 or vehicle (CTL) twice a week for 2 weeks. The day before the last injection of RAP-031 or vehicle both TAs were injured by cardiotoxin injection. Mice were sacrificed 2 weeks after injury. (B) Representative images of cross-sections from injured TA muscles of CTL (Upper) and RAP-031 (Lower) mice injected with DT or PBS as described in (A), immunostained for mGFP (green) to identify satellite cell-derived fibers and Pax7 (orange) to identify satellite cells. mTomato fluorescence is shown in red, DAPI staining (blue) identifies nuclei. The majority of regenerating fibers are satellite cell-derived (green) regardless of treatment. White arrowheads: satellite cells. Scale bar, 30 μm. (C,D) Quantification of the number of mGFPpos (C) and mGFPnegmTomatopos (D) fibers per 100 centrally nucleated fibers for CTL and RAP-03 mice injected with PBS or DT, as described in (A). Values represent the mean number of positive fibers ± s.e.m. per 100 centrally nucleated fibers. Random images were captured at 20X magnification and at least 5 different fields for each section were counted, n = 3 animals were considered for each group. *p < 0.05, **p < 0.01.
Figure 4
Figure 4
Proposed cellular model of satellite cell and stem cell niche interactions. Top Row- In resting muscle containing an intact population of satellite cells (Left), pro-myogenic signals (green arrow) from PICs/FAPs (green), and anti-adipogenic signals (red arrow) from satellite cells (red) are kept in a tight balance, which is maintained after injury (Right). Second Row- Following AcvR2B inhibition, PICs and satellite cell populations expand, however pro- and anti-myogenic balance in maintained before and after injury. Third Row- Satellite cell depletion disrupts the balance and overall levels of factors regulating the niche (Left) and signaling within the niche is completely deregulated following injury (Right). This results in a complete loss of satellite cells and consequently a loss of satellite cell derived anti-adipogenic signals allowing FAP progression into fat and fibrosis (Right). Fourth Row- AcvR2B inhibitor treatment of satellite cell depleted muscle reinforces the niche (Left) and allows for satellite cell myogenic progression/self-renewal and consequently the maintenance of a minimal balance of factors required to restore the muscle tissue and stem cell niche (Right).

References

    1. Akpan I., Goncalves M. D., Dhir R., Yin X., Pistilli E. E., Bogdanovich S., et al. . (2009). The effects of a soluble activin type IIB receptor on obesity and insulin sensitivity. Int. J. Obes. (Lond). 33, 1265–1273. 10.1038/ijo.2009.162 - DOI - PMC - PubMed
    1. Amthor H., Nicholas G., McKinnell I., Kemp C. F., Sharma M., Kambadur R., et al. . (2004). Follistatin complexes Myostatin and antagonises Myostatin-mediated inhibition of myogenesis. Dev. Biol. 270, 19–30. 10.1016/j.ydbio.2004.01.046 - DOI - PubMed
    1. Amthor H., Otto A., Vulin A., Rochat A., Dumonceaux J., Garcia L., et al. (2009). Muscle hypertrophy driven by myostatin blockade does not require stem/precursor-cell activity. Proc. Natl. Acad. Sci. U.S.A. 106, 7479–7484. 10.1073/pnas.0811129106 - DOI - PMC - PubMed
    1. Artaza J. N., Singh R., Ferrini M. G., Braga M., Tsao J., Gonzalez-Cadavid N. F. (2008). Myostatin promotes a fibrotic phenotypic switch in multipotent C3H 10T1/2 cells without affecting their differentiation into myofibroblasts. J. Endocrinol. 196, 235–249. 10.1677/JOE-07-0408 - DOI - PubMed
    1. Besson V., Kyryachenko S., Janich P., Benitah S. A., Marazzi G., Sassoon D. (2017). Expression analysis of the stem cell marker Pw1/Peg3 Reveals a CD34 Negative Progenitor Population in the Hair Follicle. Stem Cells. 35, 1015–1027. 10.1002/stem.2540 - DOI - PubMed

LinkOut - more resources