. 2018 Aug;61(8):1794-1803.
doi: 10.1007/s00125-018-4651-x. Epub 2018 Jun 7.

Loss of CXCR3 expression on memory B cells in individuals with long-standing type 1 diabetes

Affiliations

Loss of CXCR3 expression on memory B cells in individuals with long-standing type 1 diabetes

Wendy E Powell et al. Diabetologia. 2018 Aug.

Abstract

Aims/hypothesis: Islet-specific autoantibodies can predict the development of type 1 diabetes. However, it remains unclear if B cells, per se, contribute to the causal pancreatic immunopathology. We aimed to identify phenotypic signatures of disease progression among naive and memory B cell subsets in the peripheral blood of individuals with type 1 diabetes.

Methods: A total of 69 participants were recruited across two separate cohorts, one for discovery purposes and the other for validation purposes. Each cohort comprised two groups of individuals with type 1 diabetes (one with newly diagnosed type 1 diabetes and the other with long-standing type 1 diabetes) and one group of age- and sex-matched healthy donors. The phenotypic characteristics of circulating naive and memory B cells were investigated using polychromatic flow cytometry, and serum concentrations of various chemokines and cytokines were measured using immunoassays.

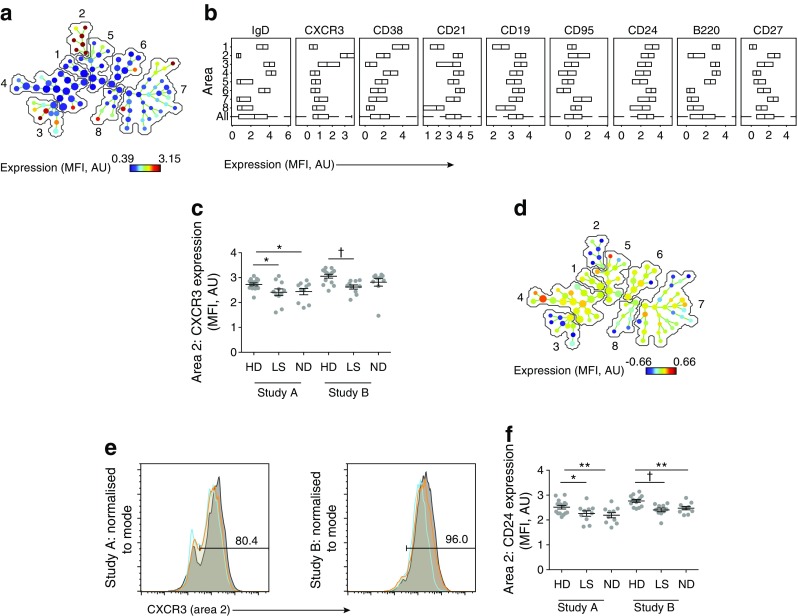
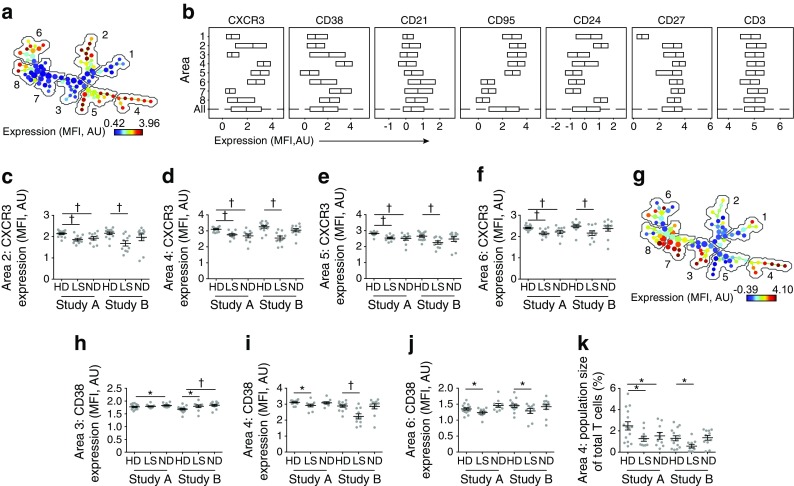
Results: A disease-linked phenotype was detected in individuals with long-standing type 1 diabetes, characterised by reduced C-X-C motif chemokine receptor 3 (CXCR3) expression on switched (CD27+IgD-) and unswitched (CD27intermediateIgD+) memory B cells. These changes were associated with raised serum concentrations of B cell activating factor and of the CXCR3 ligands, chemokine (C-X-C motif) ligand (CXCL)10 and CXCL11. A concomitant reduction in CXCR3 expression was also identified on T cells.

Conclusions/interpretation: Our data reveal a statistically robust set of abnormalities that indicate an association between type 1 diabetes and long-term dysregulation of a chemokine ligand/receptor system that controls B cell migration.

Keywords: Autoimmunity; B cells; B220; BAFF; CD24; CD95; CXCL10; CXCL11; CXCR3; Type 1 diabetes.


Conflict of interest statement

The authors declare that there is no duality of interest associated with this manuscript.

Figures

Fig. 1
Fig. 1
Automated phenotypic analysis of B cells. (a) SPADE image of pooled B cells from all participants, auto-partitioned into eight annotated areas with node size scaled to the log number of cells in each node, showing median CXCR3 expression (transformed values in SPADE using arcsinh transformation with cofactor 150) as a heatmap. Annotated areas: 1. naive (CD27IgD+); 2. switched memory (CD27+IgD); 3. unswitched (CD27intIgD+); 4. naive (CD27IgD+); 5. switched (CD27IgD); 6. unswitched (CD27intIgD+); 7. switched memory (CD27+IgD); 8. switched (CD27-IgD). (b) Box plots of marker distribution in each area (or in all areas [All]) for the pooled samples depicted in (a) (central lines indicate medians, and outer lines indicate IQRs). (c) CXCR3 expression (transformed values) in area 2 for each individual. (d) SPADE image of pooled B cells from all participants, auto-partitioned into eight annotated areas (as in a) with node size scaled to the log number of cells in each node, showing the ratio of median CXCR3 expression (individuals with long-standing diabetes:healthy donors; transformed values) in Study B. (e) Histogram overlays of CXCR3 expression in area 2 for Studies A and B. Orange, newly diagnosed individuals; blue, individuals with long-standing diabetes; grey, healthy donors. (f) CD24 expression (transformed values) in area 2 for each individual. *p < 0.05, **p < 0.01, p < 0.005, Student’s t test. AU, arbitrary units; HD, healthy donor; ND, newly diagnosed diabetes; LS, long-standing diabetes. Means ± SEM are shown
Fig. 2
Fig. 2
Extended phenotypic analysis of B cells. Expression levels of surface markers that differed significantly between B cell subsets in individuals with type 1 diabetes and healthy donors are shown (transformed values in SPADE using arcsinh transformation with cofactor 150) for each participant (related to Fig. 1a). (a) CXCR3 expression in area 3 (unswitched CD27int); (b) CD24 expression in area 6 (unswitched CD27int); (c) B220 expression in area 3 (unswitched CD27int); (d) B220 expression in area 4 (naive cells); and (e) CD95 expression in area 7 (switched CD27+ memory cells). *p < 0.05, **p < 0.01, p < 0.005, Student’s t test. AU, arbitrary units; HD, healthy donor; ND, newly diagnosed diabetes; LS, long-standing diabetes. Means ± SEM are shown
Fig. 3
Fig. 3
Conventional phenotypic analysis of B and T cells. Manually gated CD27+CXCR3+IgD B cells were analysed for expression of (a) CXCR3 and (b) CD24. (c) Manually gated CXCR3+ T cells were analysed for expression of CXCR3. (d) Manually gated CD38+CXCR3+ T cells were quantified in each individual. *p < 0.05, **p < 0.01, p < 0.005, one-way ANOVA with Dunnett’s post hoc test. Values are MFI calculated in FlowJo (not transformed). AU, arbitrary units; HD, healthy donor; ND, newly diagnosed diabetes; LS, long-standing diabetes. Means ± SEM are shown
Fig. 4
Fig. 4
Phenotypic analysis of T cells. (a) SPADE image of pooled T cells from all participants, auto-partitioned into eight annotated areas with node size scaled to the log number of cells in each node (see b for details of each numbered area), showing median CXCR3 expression (transformed values in SPADE using arcsinh transformation with cofactor 150) as a heatmap. (b) Box plots of marker distribution in each area (or in all areas [All]) for the pooled samples depicted in (a) (the central line in the box plot indicates median, and outer lines IQR). (cf) CXCR3 expression (transformed values in SPADE using arcsinh transformation with cofactor 150) in the indicated areas (depicted in a) for each participant. (g) SPADE image of pooled T cells from all individuals, auto-partitioned into eight annotated areas (as in a) with node size scaled to the log number of cells in each node, showing median CD38 expression (transformed values in SPADE) as a heatmap. (hj) CD38 expression (transformed values in SPADE) in the indicated areas (depicted in a) for each participant. (k) Number of cells in area 4 for each participant. *p < 0.05, p < 0.005, Student’s t test. AU, arbitrary units; HD, healthy donor; ND, newly diagnosed diabetes; LS, long-standing diabetes. Means ± SEM are shown
Fig. 5
Fig. 5
Analysis of serum chemokines and cytokines. Serum concentration of (a) CXCL10, (b) CXCL11, (c) CXCL9 and (d) BAFF for each participant. *p < 0.05, **p < 0.01, p < 0.005, Kruskal–Wallis test with Dunn’s post hoc test. HD, healthy donor; ND, newly diagnosed diabetes; LS, long-standing diabetes. Medians ± IQR are shown

Similar articles

Cited by

References

    1. Pescovitz MD, Greenbaum CJ, Bundy B, et al. B-lymphocyte depletion with rituximab and β-cell function: two-year results. Diabetes Care. 2014;37:453–459. doi: 10.2337/dc13-0626. - DOI - PMC - PubMed
    1. Itoh N, Hanafusa T, Miyazaki A, et al. Mononuclear cell infiltration and its relation to the expression of major histocompatibility complex antigens and adhesion molecules in pancreas biopsy specimens from newly diagnosed insulin-dependent diabetes mellitus individuals. J Clin Invest. 1993;92:2313–2322. doi: 10.1172/JCI116835. - DOI - PMC - PubMed
    1. Willcox A, Richardson SJ, Bone AJ, Foulis AK, Morgan NG. Analysis of islet inflammation in human type 1 diabetes. Clin Exp Immunol. 2009;155:173–181. doi: 10.1111/j.1365-2249.2008.03860.x. - DOI - PMC - PubMed
    1. Habib T, Funk A, Rieck M, et al. Altered B cell homeostasis is associated with type I diabetes and carriers of the PTPN22 allelic variant. J Immunol. 2012;188:487–496. doi: 10.4049/jimmunol.1102176. - DOI - PMC - PubMed
    1. Thompson WS, Pekalski ML, Simons HZ, et al. Multi-parametric flow cytometric and genetic investigation of the peripheral B cell compartment in human type 1 diabetes. Clin Exp Immunol. 2014;177:571–585. doi: 10.1111/cei.12362. - DOI - PMC - PubMed

Publication types