. 2018 Oct 15;198(8):1043-1054.
doi: 10.1164/rccm.201801-0064OC.

Unintended Consequences: Fluid Resuscitation Worsens Shock in an Ovine Model of Endotoxemia

Affiliations

Unintended Consequences: Fluid Resuscitation Worsens Shock in an Ovine Model of Endotoxemia

Liam Byrne et al. Am J Respir Crit Care Med. .

Abstract

Rationale: Fluid resuscitation is widely considered a life-saving intervention in septic shock; however, recent evidence has brought both its safety and efficacy in sepsis into question.

Objectives: In this study, we sought to compare fluid resuscitation with vasopressors with the use of vasopressors alone in a hyperdynamic model of ovine endotoxemia.

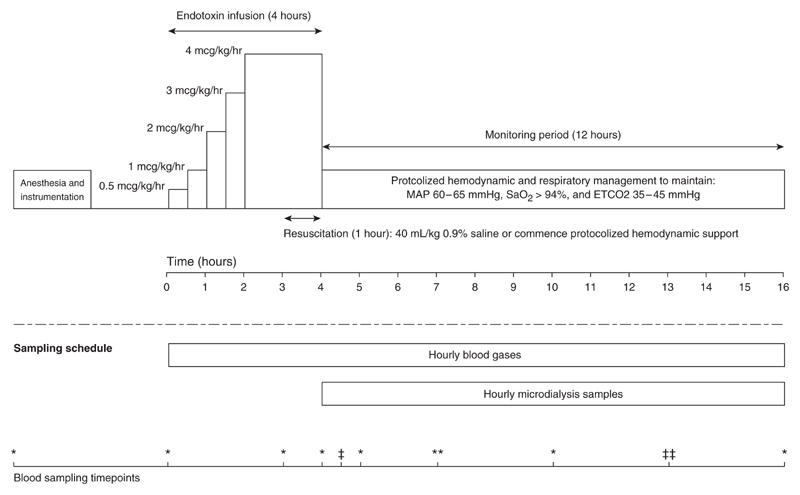
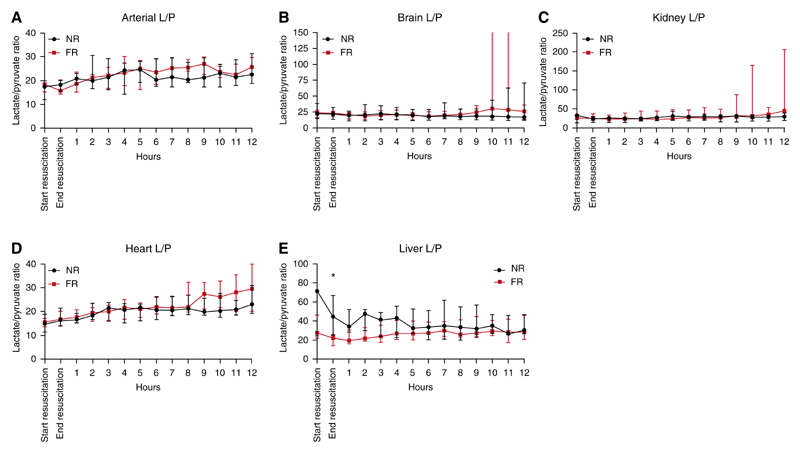
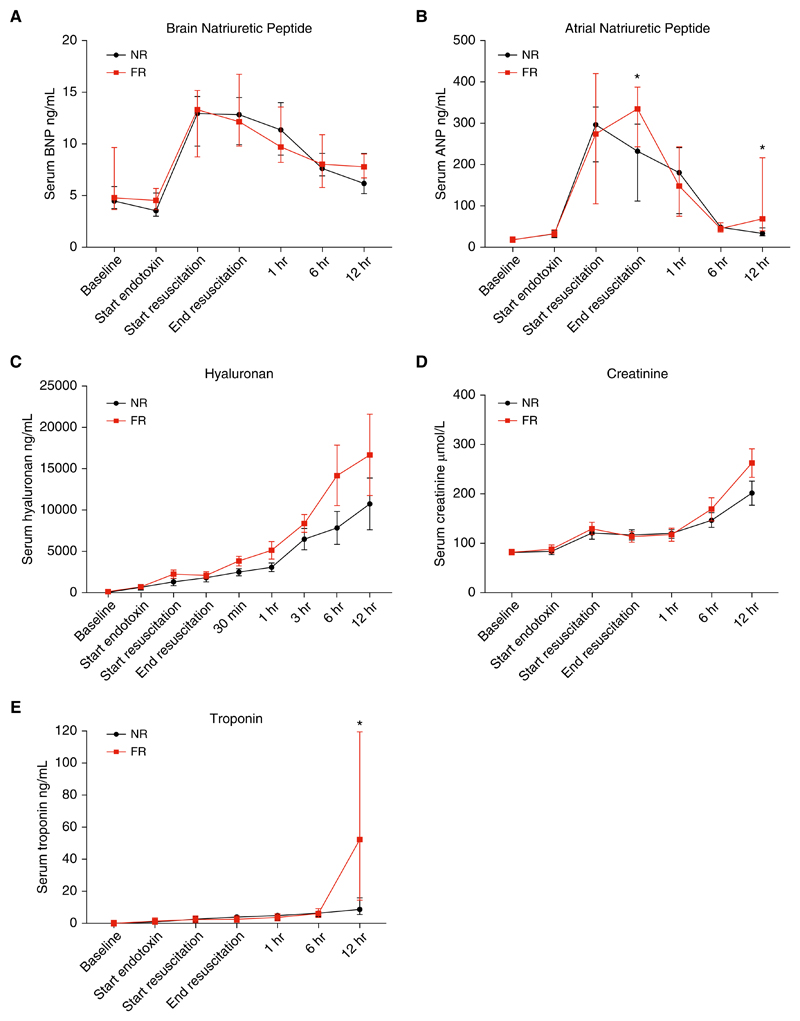
Methods: Endotoxemic shock was induced in 16 sheep, after which they received fluid resuscitation with 40 ml/kg of 0.9% saline or commenced hemodynamic support with protocolized noradrenaline and vasopressin. Microdialysis catheters were inserted into the arterial circulation, heart, brain, kidney, and liver to monitor local metabolism. Blood samples were recovered to measure serum inflammatory cytokines, creatinine, troponin, atrial natriuretic peptide, brain natriuretic peptide, and hyaluronan. All animals were monitored and supported for 12 hours after fluid resuscitation.

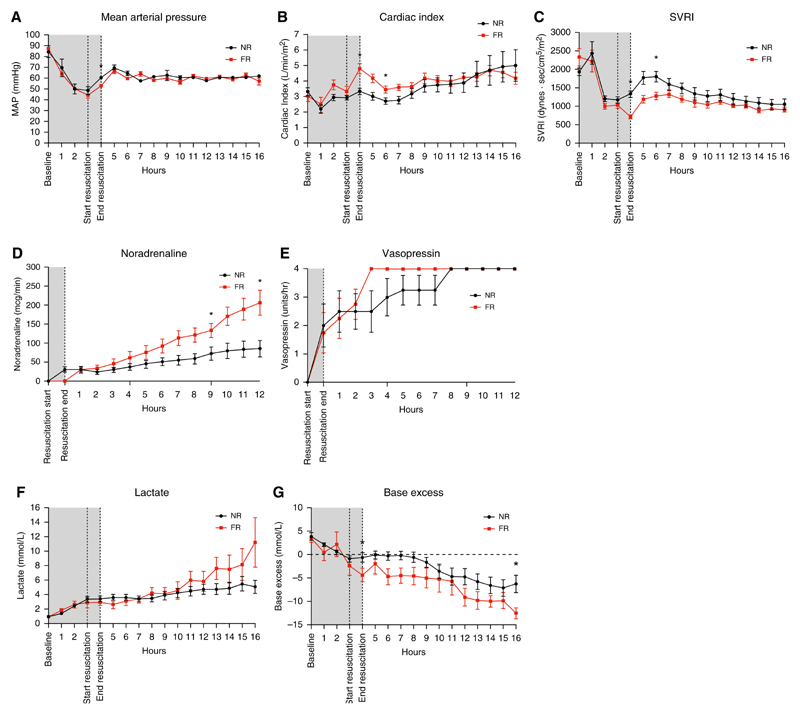
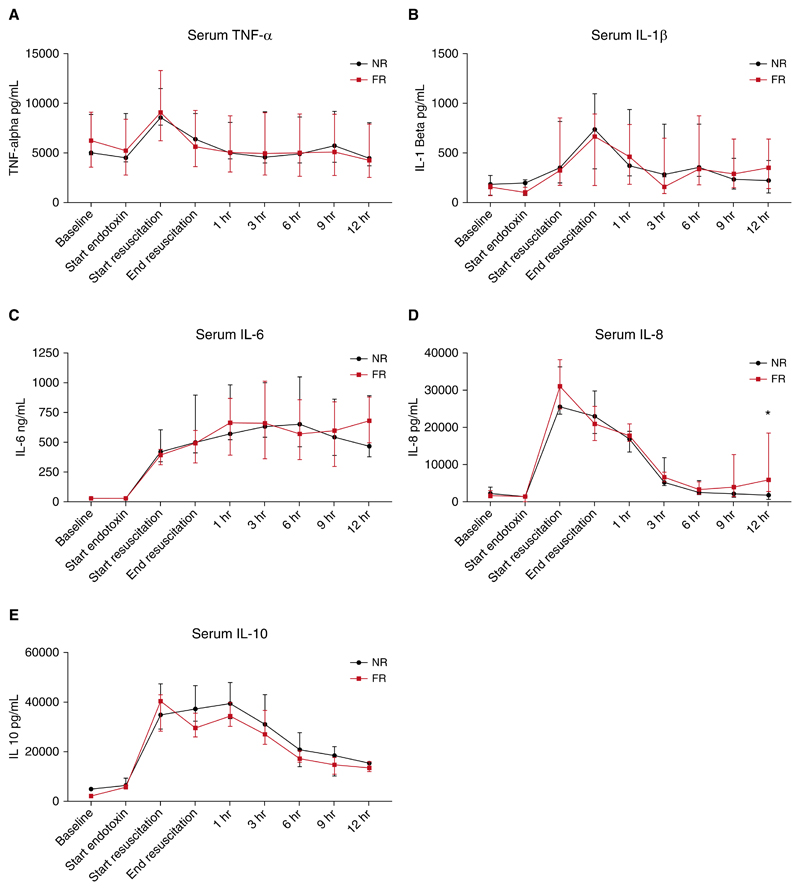
Measurements and main results: After resuscitation, animals that received fluid resuscitation required significantly more noradrenaline to maintain the same mean arterial pressure in the subsequent 12 hours (68.9 mg vs. 39.6 mg; P = 0.04). Serum cytokines were similar between groups. Atrial natriuretic peptide increased significantly after fluid resuscitation compared with that observed in animals managed without fluid resuscitation (335 ng/ml [256-382] vs. 233 ng/ml [144-292]; P = 0.04). Cross-sectional time-series analysis showed that the rate of increase of the glycocalyx glycosaminoglycan hyaluronan was greater in the fluid-resuscitated group over the course of the study (P = 0.02).

Conclusions: Fluid resuscitation resulted in a paradoxical increase in vasopressor requirement. Additionally, it did not result in improvements in any of the measured microcirculatory- or organ-specific markers measured. The increase in vasopressor requirement may have been due to endothelial/glycocalyx damage secondary to atrial natriuretic peptide-mediated glycocalyx shedding.

Keywords: endotoxemia; fluid resuscitation; sepsis; septic shock.


Figures

Figure 1
Figure 1
Schematic representation of the experimental protocol. Anesthesia and surgical instrumentation were followed by a 1-hour stabilization period during which no interventions were performed. Endotoxemic shock was induced with a 4-hour escalating dose of endotoxin infusion. Resuscitation occurred in the last hour of the endotoxin infusion, with animals either receiving a 40 ml/kg bolus of 0.9% saline or commencing protocolized hemodynamic support. After resuscitation, all animals were monitored for a further 12 hours, during which time both groups received protocolized hemodynamic and respiratory support. Blood gases were taken hourly during the 16 hours of the experiment and analyzed immediately on an ABL800 Flex (Radiometer). During the monitoring period, hourly microdialysis samples were recovered and analyzed for lactate and pyruvate on an ISCUS clinical microdialysis analyzer (Hammarby Fabriksvag). The bottom scale indicates the blood-sampling time points throughout the experiment. *Time points at which blood was taken for serum cytokines (IL-1 β, Il-6, IL-8, IL-10, and tumor necrosis factor α [TNF-α]), troponin, atrial natriuretic peptide (ANP), brain natriuretic peptide (BNP), hyaluronan, and creatinine. *Time points at which blood was taken to measure hyaluronan only. **Time points at which blood was taken to measure serum cytokines and hyaluronan. **Time points at which blood was taken to measure serum cytokines. Cytokine measurements were performed using an in-house ELISA for IL-1β, IL-6, IL-8, IL-10, and TNF-α. The methodology of the cytokine analysis has been described previously (13). Cardiac troponin I was measured using the Unicel DxI AccuTnI+3 immunoassay (Beckman Coulter). Hyaluronan was measured using a hyaluronan Quantikine ELISA Kit (R&D Systems). Serum ANP and BNP were measured using a custom ovine radioimmunoassay (Endolab). Creatinine was measured using a COBAS Integra 400 blood chemistry analyzer (Roche Diagnostics). ETCO2 = end-tidal CO2; MAP = mean arterial pressure.
Figure 2
Figure 2. Hemodynamic, vasopressor, and acid/base variables during the experiment in both fluid-resuscitated (FR) and non−fluid-resuscitated (NR) animals.
(A) Mean arterial pressure during endotoxemia, resuscitation, and the postresuscitation monitoring period. Gray shading corresponds to the time period of endotoxin infusion. Results are expressed as mean ± SD. (B and C) Cardiac index and systemic vascular resistance during the experiment. Results are expressed as median values with interquartile range (IQR). (D) Noradrenaline infusion rate during the experiment, median, and IQR. Linear regression analysis demonstrated the rate of increase to be significantly greater in the FR group. (E) Vasopressin infusion rates during the experiment (median and IQR). There was no significant difference in vasopressin infusion rates. All animals required the maximal dose of vasopressin by the end of the study. (F and G) Lactate and base excess over the experiment; data are represented as mean ± SD. *Time points with a statistically significant difference (P < 0.05). MAP = mean arterial pressure; SVRI = systemic vascular resistance index.
Figure 3
Figure 3. Individual organ lactate/pyruvate (L/P) ratios for the period after resuscitation in fluid-resuscitated (FR) and non−fluid-resuscitated (NR) animals.
(A) Arterial L/P ratios during the postresuscitation period. Values were similar between the groups throughout. (B) Brain L/P ratios during the postresuscitation period. The variance seen in interquartile range (IQR) after hour 10 was due to a rapid increase in the L/P ratio in a single animal in the final 3 hours of the experiment to >3,400. (C) Kidney L/P ratio during the same period. There was no significant difference between the groups at any time point. (D) Heart L/P ratio during the same period. There was no significant difference between the groups at any time point. (E) Liver L/P ratios during the period after resuscitation. Values started at a higher baseline for the NR group than for the FR group. After resuscitation, values were significantly greater for the NR animals than for the FR animals. All data are represented as median values with IQR. *P < 0.05.
Figure 4
Figure 4. Plasma cytokine levels for both fluid-resuscitated (FR) and non−fluid-resuscitated (NR) animals throughout the experiment.
(A) Serum tumor necrosis factor-α (TNF-α) increased during endotoxemia, reaching peak values in both groups at the beginning of resuscitation before returning to near baseline levels. (B) Serum IL-1β increased during endotoxemia in both groups, reaching maximal values at the end of resuscitation. (C) Endotoxemia produced large increases in IL-6 in both groups that were sustained throughout the study. (D) Serum IL-8 reached maximal values in both groups at the beginning of resuscitation. IL-8 decreased in both groups after resuscitation; however, there was a late increase in IL-8 in the FR animals, and the final IL-8 values were statistically significantly different between the groups (*P = 0.04). (E) Endotoxin produced a large increase in IL-10 in both groups that slowly decreased throughout the monitoring period. Results are expressed as median values and interquartile range.
Figure 5
Figure 5. Cardiovascular and renal biomarkers during the experiment in both fluid-resuscitated (FR) and non−fluid-resuscitated (NR) animals.
(A) Endotoxemia produced a large increase in plasma brain natriuretic peptide (BNP) in both groups that then declined throughout the observation period in both groups (median and interquartile range [IQR]). (B) Serum atrial natriuretic peptide (ANP) increased in response to endotoxemia in both groups. Plasma ANP peaked at the initiation of resuscitation in the NR group. In the FR group, plasma ANP rose with endotoxemia and increased further after resuscitation. There was a statistically significant difference in plasma ANP between the groups after resuscitation (*P < 0.05) (median and IQR). (C) Hyaluronan increased in both groups during the study (mean ± SD). (D) Serum creatinine was not significantly different at any time point and increased in both groups throughout the study (median and IQR). (E) Serum troponin values were similar between the groups until the end of the experiment, when there was a large increase in the FR animals (median and IQR) (*P = 0.03).

Comment in

References

    1. Angus DC, van der Poll T. Severe sepsis and septic shock. N Engl J Med. 2013;369:840–851. - PubMed
    1. Hodgin KE, Moss M. The epidemiology of sepsis. CurrPharm Des. 2008;14:1833–1839. - PubMed
    1. Linde-Zwirble WT, Angus DC. Severe sepsis epidemiology: sampling, selection, and society. Crit Care. 2004;8:222–226. - PMC - PubMed
    1. Rhodes A, Evans LE, Alhazzani W, Levy MM, Antonelli M, Ferrer R, et al. Surviving Sepsis Campaign: international guidelines for management of sepsis and septic shock: 2016. Intensive Care Med. 2017;43:304–377. - PubMed
    1. Dellinger RP, Carlet JM, Masur H, Gerlach H, Calandra T, Cohen J, et al. Surviving Sepsis Campaign guidelines for management of severe sepsis and septic shock. Intensive Care Med. 2004;30:536–555. - PubMed

Publication types