. 2018 Jun 8;32(12):fj201800370R.
doi: 10.1096/fj.201800370R. Online ahead of print.

Obesity treatment by epigallocatechin-3-gallate-regulated bile acid signaling and its enriched Akkermansia muciniphila

Affiliations

Obesity treatment by epigallocatechin-3-gallate-regulated bile acid signaling and its enriched Akkermansia muciniphila

Lili Sheng et al. FASEB J. .

Abstract

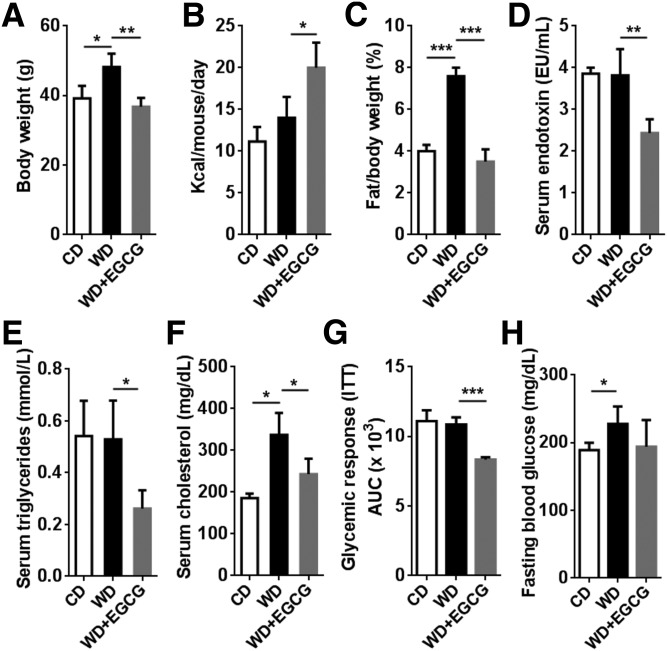
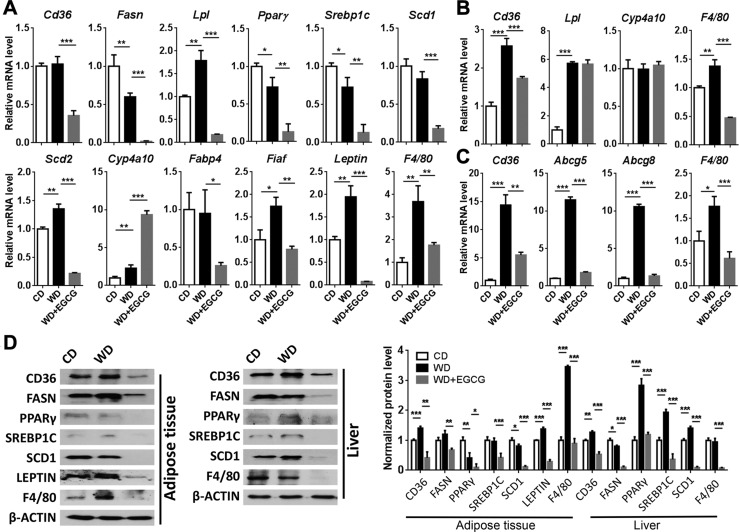
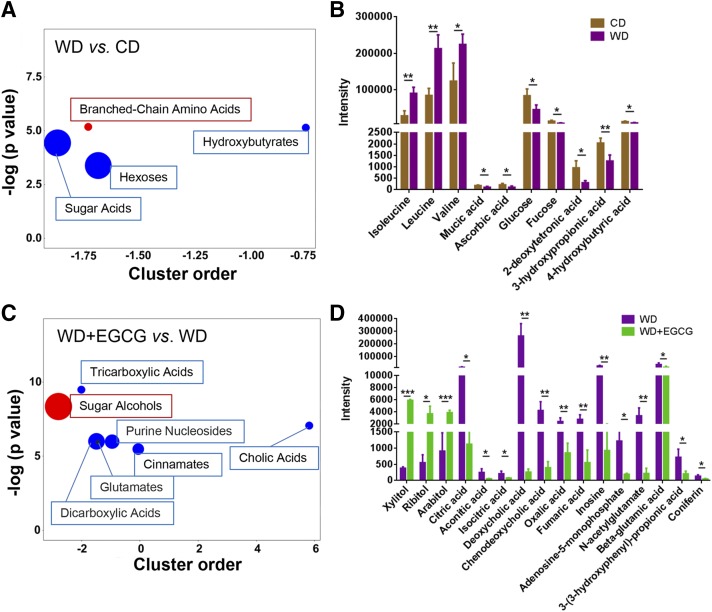
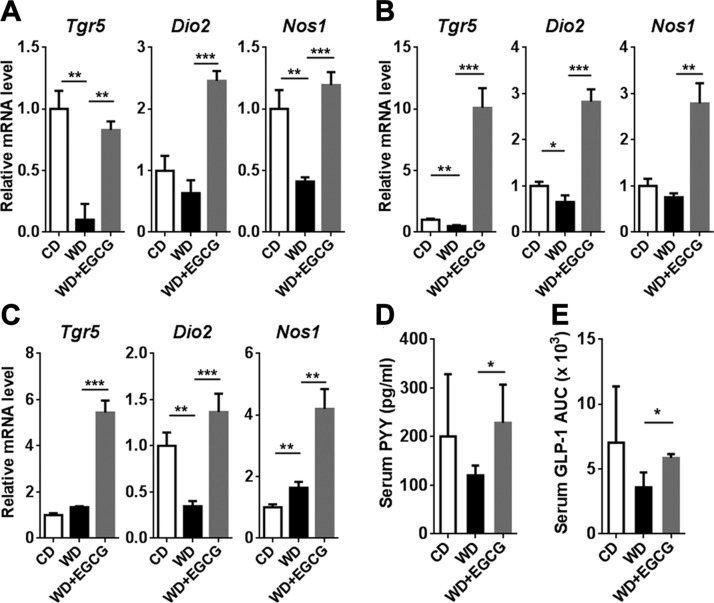
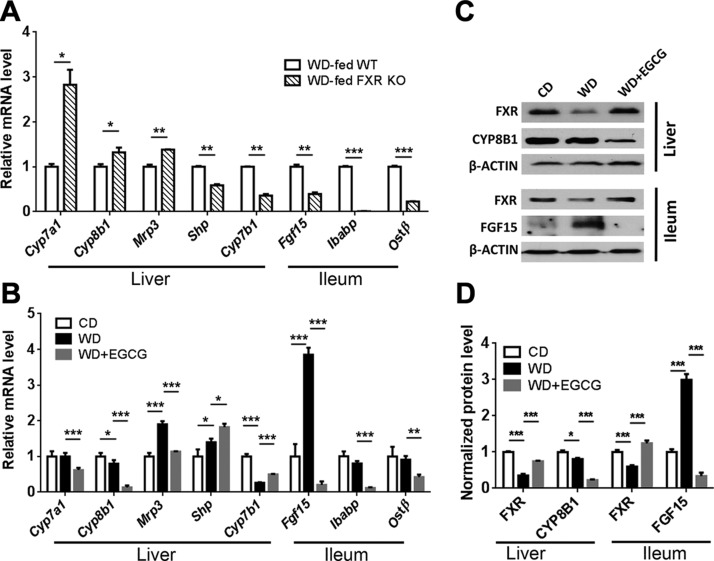
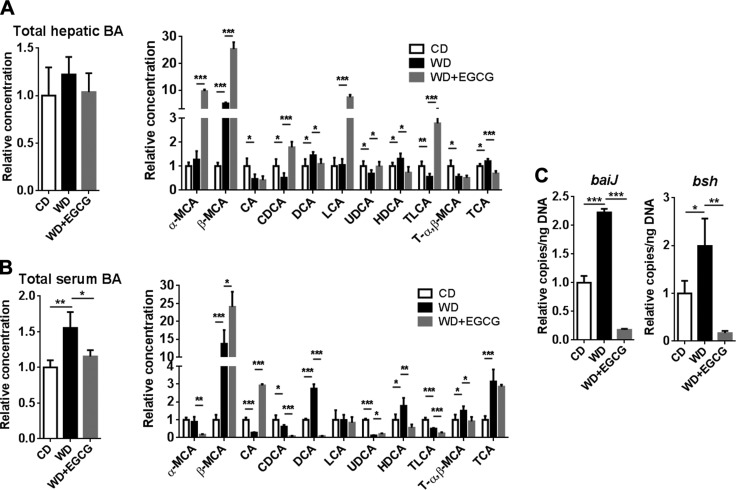
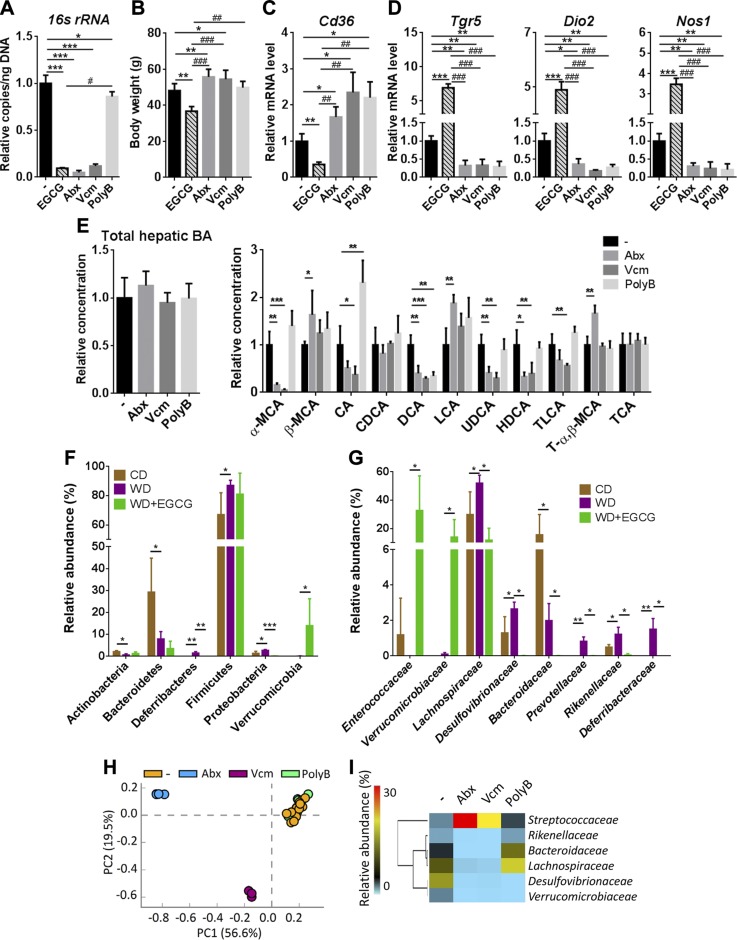
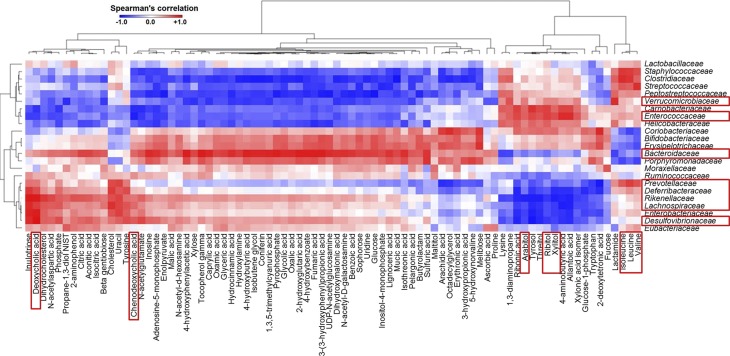
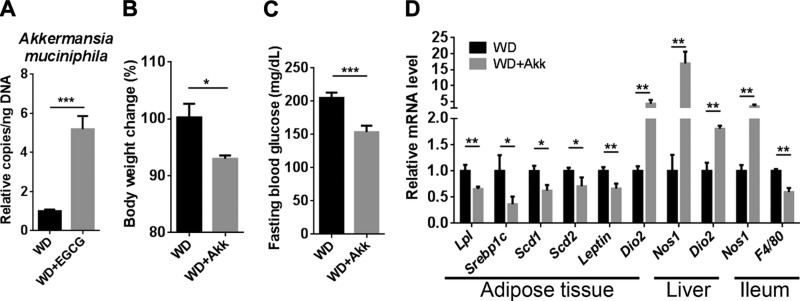
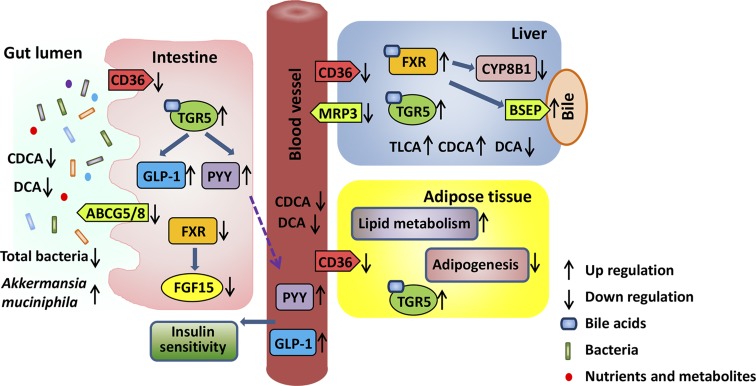
Dysregulated bile acid (BA) synthesis is accompanied by dysbiosis, leading to compromised metabolism. This study analyzes the effect of epigallocatechin-3-gallate (EGCG) on diet-induced obesity through regulation of BA signaling and gut microbiota. The data revealed that EGCG effectively reduced diet-increased obesity, visceral fat, and insulin resistance. Gene profiling data showed that EGCG had a significant impact on regulating genes implicated in fatty acid uptake, adipogenesis, and metabolism in the adipose tissue. In addition, metabolomics analysis revealed that EGCG altered the lipid and sugar metabolic pathways. In the intestine, EGCG reduced the FXR agonist chenodeoxycholic acid, as well as the FXR-regulated pathway, suggesting intestinal FXR deactivation. However, in the liver, EGCG increased the concentration of FXR and TGR-5 agonists and their regulated signaling. Furthermore, our data suggested that EGCG activated Takeda G protein receptor (TGR)-5 based on increased GLP-1 release and elevated serum PYY level. EGCG and antibiotics had distinct antibacterial effects. They also differentially altered body weight and BA composition. EGCG, but not antibiotics, increased Verrucomicrobiaceae, under which EGCG promoted intestinal bloom of Akkermansia muciniphila. Excitingly, A. muciniphila was as effective as EGCG in treating diet-induced obesity. Together, EGCG shifts gut microbiota and regulates BA signaling thereby having a metabolic beneficial effect.-Sheng, L., Jena, P. K., Liu, H.-X., Hu, Y., Nagar, N., Bronner, D. N., Settles, M. L., Bäumler, A. J. Wan, Y.-J. Y. Obesity treatment by epigallocatechin-3-gallate-regulated bile acid signaling and its enriched Akkermansia muciniphila.

Keywords: bile acid receptor; catechin; gut microbiota; probiotics; tea.


Conflict of interest statement

The authors thank Dr. Frank J. Gonzalez [U.S. National Institutes of Health (NIH) National Cancer Institute] for providing FXR KO mice, and Dr. Mel Campbell (University of California, Davis) for editing the manuscript. This study was supported by NIH National Cancer Institute Grants U01CA179582 and R01CA222490 (to Y.-J. Y. Wan). The authors declare no conflicts of interest.

Figures

Figure 1
Figure 1
Phenotypes of CD, WD, and WD+EGCG-fed mice. AF) Body weight (A); food intake (B); visceral fat:body weight ratio (C); serum endotoxin level (D); serum triglycerides (E); and cholesterol level (F). G, H) AUC in an insulin sensitivity test (G) and fasting blood glucose level (H) (n = 3–4/group). Data are expressed as means ± sd. *P < 0.05, **P < 0.01, ***P < 0.001 (1-way ANOVA with Tukey’s correction).
Figure 2
Figure 2
AC) The expression of fatty acid synthesis and metabolism genes in adipose tissue (A), liver (B), and ileum (C) of CD-, WD- and WD+EGCG–fed mice. D) Western blot analysis of indicated protein levels in the adipose tissue and liver. The bar graph shows the quantitative results of indicated proteins, which were normalized with corresponding β-Actin level (n = 3–4/group). Data are expressed as means ± sd. *P < 0.05, **P < 0.01, ***P < 0.001 (1-way ANOVA with Tukey’s correction).
Figure 3
Figure 3
Untargeted metabolomics study. ChemRICH metabolite set enrichment statistics plot (A), and the intensity of metabolites detected by GC-TOF-MS (B) in CD-, WD-, and WD+EGCG-fed mice (C, D). The node color shows increased (red) or decreased (blue) metabolite sets in WD-fed mice vs. CD-fed mice (A) or WD+EGCG-fed mice vs. WD-fed mice (C). The node sizes represent the total number of metabolites in each cluster set. *P < 0.05, **P < 0.01, ***P < 0.001.
Figure 4
Figure 4
The expression of the Tgr5 gene as well as TGR-5–regulated signaling genes. AC) Gene expression in the liver (A), adipose tissue (B), and ileum(C). D) Serum PYY level after 12 h of food withdrawal. E) GLP-1 secretion after liquid diet stimulation. The AUC is shown (n = 3–4/group). Data are means ± sd. *P < 0.05, **P < 0.01, ***P < 0.001 (1-way ANOVA with Tukey’s correction).
Figure 5
Figure 5
Expression of genes implicated in BA homeostasis. A) Hepatic and ileal gene expression in WD-fed WT and WD-fed FXR KO mice. B) Expression of BA homeostasis genes in the liver and ileum of CD, WD, and WD+EGCG-fed WT mice. C) Western blot analysis of indicated protein levels in the liver and ileum. D) Quantitative results of the indicated proteins, which were normalized to the corresponding β-Actin level (n = 3–4/group). Data are means ± sd. *P < 0.05, **P < 0.01, ***P < 0.001 (1-way ANOVA with Tukey’s correction).
Figure 6
Figure 6
BA profile in CD- and WD-fed mice as well as WD-fed mice supplemented with EGCG. Total hepatic and individual BA (A); total serum and individual BA (B); and bacterial gene abundance in cecal content (C) (n = 3–4 per group). Data are means ± sd. One-way ANOVA with Tukey’s correction. *P < 0.05, **P < 0.01, ***P < 0.001.
Figure 7
Figure 7
The effect of EGCG and antibiotics on gut bacteria, gene expression, and hepatic BA profile in WD-fed mice. A) The antibacterial effect of EGCG and antibiotics. B) Body weight of EGCG and antibiotic-treated mice. C) Cd36 mRNA levels in the adipose tissue of EGCG and antibiotic-treated mice. D) The expression of the Tgr5 gene and TGR-5–regulated signaling genes in the liver of EGCG and antibiotic-treated mice. E) Total hepatic and individual BAs in antibiotic-treated mice. F, G) Cecal microbiota composition at the phylum level (F) and relative abundance at the family level (G) in CD- and WD-fed mice and mice without and without EGCG supplementation. Data are means ± sd. Mann-Whitney U test. H) A PCA plot of cecal microbiota at family level in antibiotic-treated mice. I) The effect of antibiotics in the abundance of bacterial families (mean relative abundance) (n = 3–4 in EGCG and antibiotic-treated groups; n = 16 for the nontreated group in the antibiotics experiment). Data are means ± sd. *P < 0.05, **P < 0.01, ***P < 0.001, vs. WD-fed untreated group; #P < 0.05, ##P < 0.01, ###P < 0.001 vs. EGCG-treated mice (2-tailed Student’s t test or 1-way ANOVA with Tukey’s correction).
Figure 8
Figure 8
A heat map generated by Spearman’s correlation analysis reveals the relationship between the abundance of bacterial families and 81 metabolites that are significantly changed by diet or EGCG supplementation.
Figure 9
Figure 9
The effect of A. muciniphila in WD-fed mice. Copy number of A. muciniphila in EGCG-treated mice (A); body weight change after A. muciniphila supplementation (B); fasting blood glucose level (C); gene expression in the adipose tissue, liver, and ileum (D) (n = 3–4). *P < 0.05, **P < 0.01, ***P < 0.001 (2-tailed Student’s t test).
Figure 10
Figure 10
The systemic effects of EGCG. EGCG reduces CD36 in the liver, adipose tissue, and intestine, indicating its systemic effect on reducing fatty acid uptake. In addition, EGCG reduces the sterol transporters Abcg5 and -8 mRNA in the intestine. In the adipose tissue, EGCG increases lipid metabolism and reduces adipogenesis, resulting in body weight loss. In bile acid–regulated pathways, EGCG increases hepatic FXR agonist CDCA and enhances FXR inhibitory effect on CYP8B1 mRNA and protein level. FXR activation regulates ATP-binding cassette transporters, such as the bile salt export pump (BSEP) and multidrug resistance protein (MRP)-3, leading to BAs and xenobiotics excretion. In the intestine, the transcriptional activity of FXR is reduced, revealed by reduced FGF-15 mRNA and protein level. Moreover, EGCG increases TGR-5 activity, as revealed by increased GLP-1 secretion, elevated serum PYY, and increased Tgr5 mRNA. Moreover, EGCG has an antibacterial effect, but enriches A. muciniphila, which has metabolic benefits. EGCG has systemic effects on improving metabolism and controlling body weight via altering gut microbiota community.

References

    1. Sudano Roccaro A., Blanco A. R., Giuliano F., Rusciano D., Enea V. (2004) Epigallocatechin-gallate enhances the activity of tetracycline in staphylococci by inhibiting its efflux from bacterial cells. Antimicrob. Agents Chemother. 48, 1968–1973 - PMC - PubMed
    1. Weber J. M., Ruzindana-Umunyana A., Imbeault L., Sircar S. (2003) Inhibition of adenovirus infection and adenain by green tea catechins. Antiviral Res. 58, 167–173 - PubMed
    1. Weinreb O., Mandel S., Amit T., Youdim M. B. (2004) Neurological mechanisms of green tea polyphenols in Alzheimer’s and Parkinson’s diseases. J. Nutr. Biochem. 15, 506–516 - PubMed
    1. Raederstorff D. G., Schlachter M. F., Elste V., Weber P. (2003) Effect of EGCG on lipid absorption and plasma lipid levels in rats. J. Nutr. Biochem. 14, 326–332 - PubMed
    1. Singh B. N., Shankar S., Srivastava R. K. (2011) Green tea catechin, epigallocatechin-3-gallate (EGCG): mechanisms, perspectives and clinical applications. Biochem. Pharmacol. 82, 1807–1821 - PMC - PubMed